Figure 7.
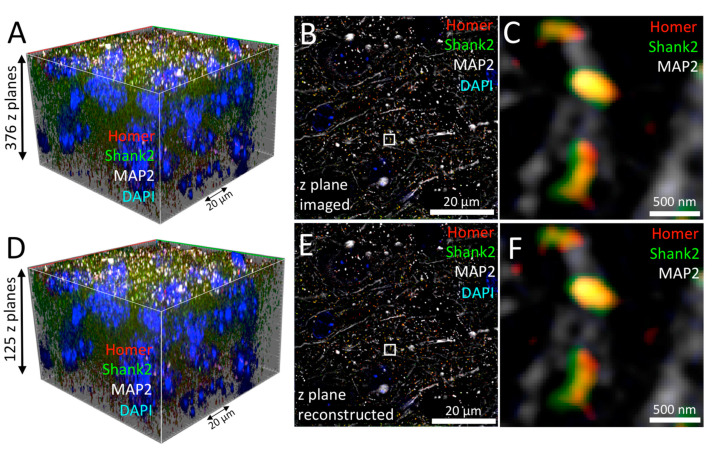
Lattice-SIM Leap reconstruction in tissue imaging. (A) A 90×90 × 50 (x/y/z) µm3 3D region of mouse brain immunofluorescently labeled with antibodies against Homer (red), Shank2/ProSAP1 (green) and MAP2 (white) was imaged using Lattice-SIM microscopy. DNA was counter-stained with DAPI (blue). A single optical section of the image stack is shown in B. (C) Enlarged view of a selected region (white box) of the image in B. (D) Leap reconstruction of the dataset shown in (A) after extraction of only every 3rd optical section. (E) Single optical section after reconstruction applying the Leap algorithm. (F) Enlarged view of a selected region (white box) of the image in E.

