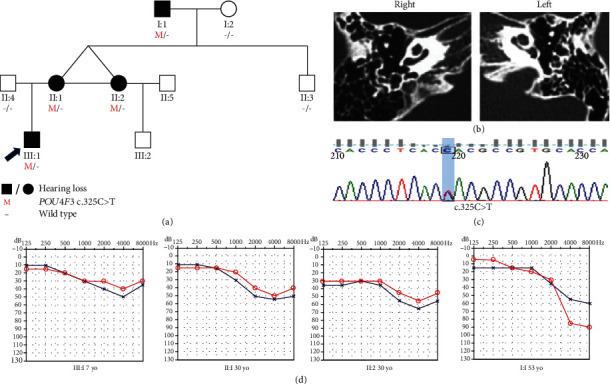
Figure 2.

Pedigree, temporal bone CT, variant analysis, and audiogram of family B. (a) Affected subjects are denoted in black. Arrow shows the proband. (b) Temporal bone CT of the III:1 shows no structural change. (c) Chromatogram shows POU4F3 heterozygous c.325C>T detected in patients. (d) Audiograms of the affected subjects. Hearing loss appears to involve high frequency (red: right ear; blue: left ear).
