
Figure 30.
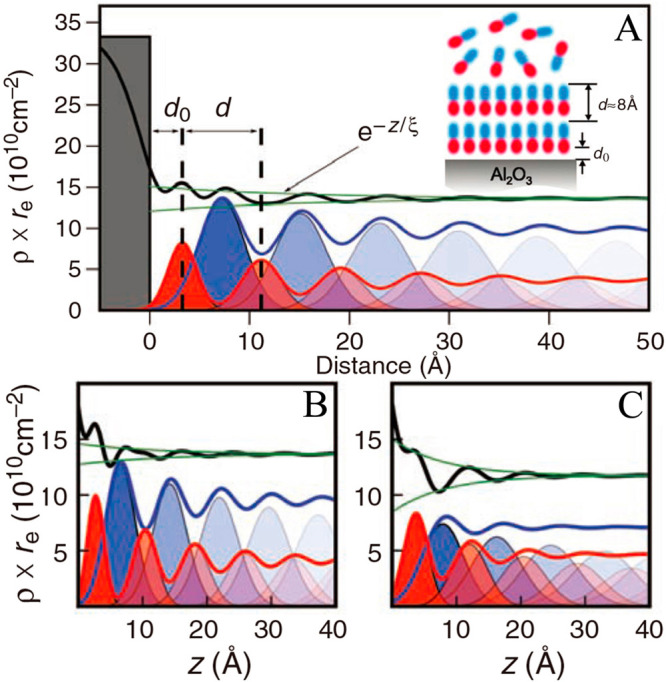
Total (black) and individual (red for cations and blue for anions) electron densities for (A) [C4MPYRR][FAP], (B) [C6MIM][FAP], and (C) [N4,4,4,4][FAP] at the IL–Al2O3 interface. Red and blue lines indicate Gaussian distributions for cations and anions contributing to their respective partial electron density profiles. The gray bar corresponds to the electron density of the Al2O3 substrate without roughness. Reproduced with permission from ref (121). Copyright 2008 American Association for the Advancement of Science.