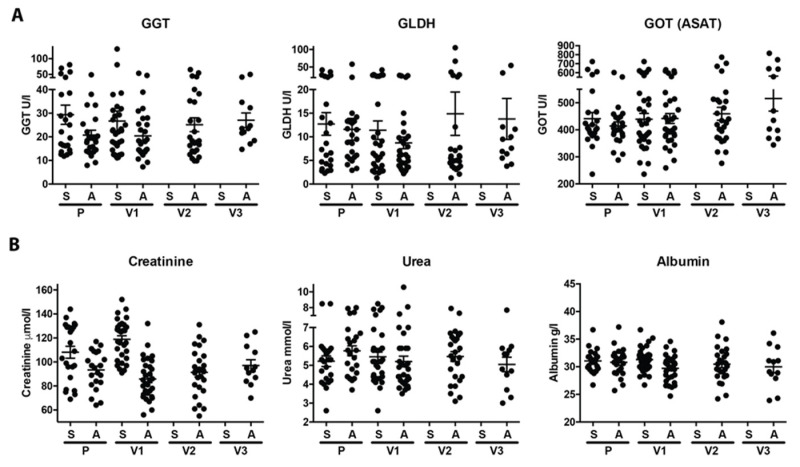
Figure 4.
Immune complex disease by liver and kidney parameters. Liver (A) and kidney (B) parameters were measured in spring (S) and autumn (A) in the placebo year and the 1st (V1), 2nd (V2), and 3rd (V3) treatment year. Values of the individual horses are shown with mean and SEM. Statistical analysis was performed by Kruskal–Wallis with Dunn’s multiple comparison. Statistical significance is only indicated when at least one value was outside of the norm.

