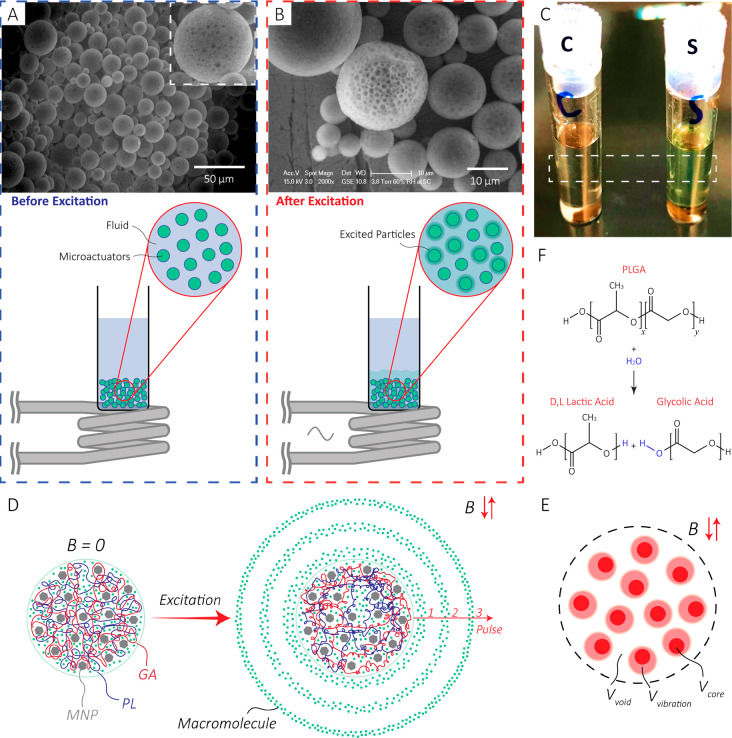
Figure 2.
(A) Before excitation: Scanning electron microscope image of the particles before excitation with the setup. Inset: A zoomed-in image of a 50 μm microactuator shows the MNPs agglomerated in the structure. (B) After excitation: Higher magnification scanning electron microscope image. As shown in the illustration, the sample vial was held over the coil to minimize any potential heat transfer. For better visual illustration, only a group of green spheres are illustarted releasing. (C) Optical image of the control (left) and sample (right) after excitation of a solution (13.5 g/L) with 1.8 kW excitation power for 20 min. As shown by the image, the sample solution’s color is greener than that of the control solution. (D) Illustration of the release mechanism. When excited, the temperature of the polymer increases, which leads to an increase in the mobility of the polymer chains. Therefore, the free volume inside the network increases, enabling a higher diffusion rate of the macromolecules. For the purpose of illustration, PL and GA are shown in distinct colors with a 50:50 length ratio. In reality, the polymer is a long chain with the PL and GA distributed along the length as shown in Figure 2F. (E) The free volume inside the network comprises the void volume (Vvoid), and the vibration volume (Vvibration) formed due to the mobility of the polymer chains. Vcore denotes the core/occupied volume. (F) The hydrolysis reaction for PLGA producing d,l lactic acid and glycolic acid.

