Figure 2.
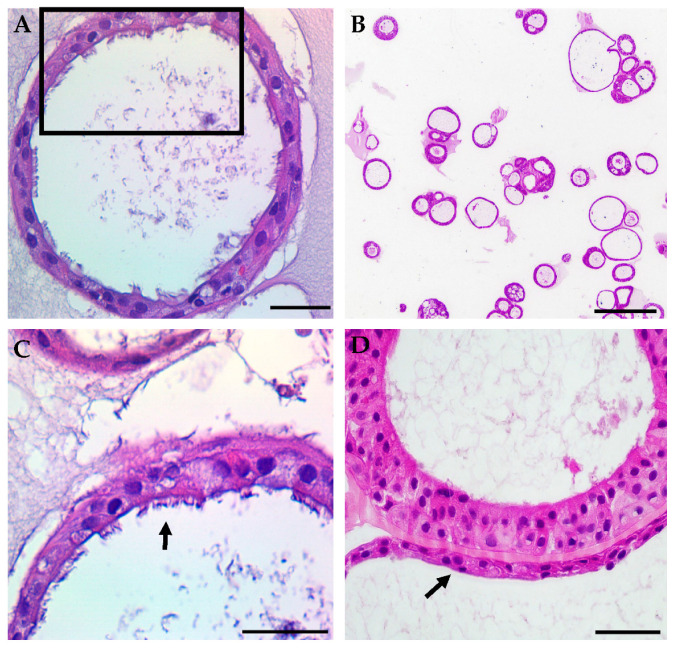
Representative samples of typical hematoxylin and eosin staining of HNE organoids show structural markers of differentiation. (A) Fully differentiated cross-section of a non-CF organoid shows a differentiated monolayer with an open lumen. Scale = 50 µm. (B) An example of the lower magnification of non-CF organoids demonstrates variations in the overall organoid morphology. Scale = 250 µm. (C) Higher magnification of the black frame in panel (A) showing a ciliated apical surface (arrow). Scale = 50 µm. (D) An example of higher magnification of G551D/unknown CF organoids showing thick and thin (arrow) epithelial walls. Scale = 50 µm.

