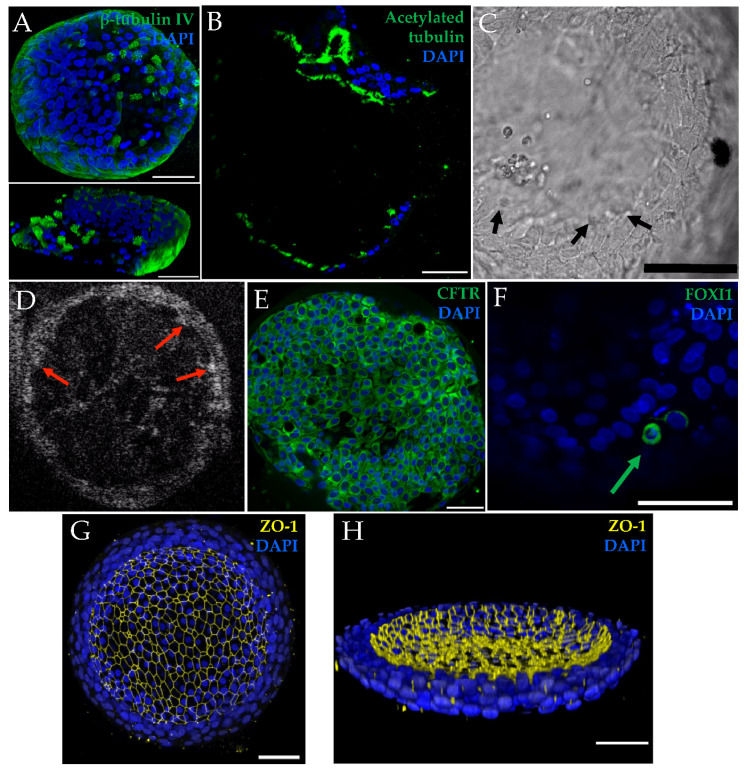
Figure 4.
Other markers of airway epithelial differentiation are shown in selected images from non-CF and CF organoids. (A) Top panel is a confocal maximal projection of β-tubulin IV in F508del/G551D organoid with a 3-D reconstruction in the bottom panel that was sliced into to show cilia protruding. Scale = 50 µm. (B) Cross-section stained with acetylated tubulin in a non-CF organoid. Scale = 50 µm. (C) Light microscopy image of still cilia (arrows) in a non-CF organoid. Scale = 100 µm. (D) µOCT image of still cilia (arrows) in a non-CF organoid. (C,D) Stills correspond with Videos S3 and S4. (E) Organoids also expressed CFTR, as seen in this representative example from F508del/R117H-5T organoids; co-localizion with ZO-1, seen in a non-CF organoid, is shown in Figure S2. Scale = 50 µm. (F) FOXI1-positive cell (arrow) in an F508del/F508del organoid. Scale = 50 µm. Maximal projection of tight-junction (ZO-1) staining (G) and a three-dimensional hemisphere demonstrating apical (luminal) localization in F508del/F508del organoids (H). Scale = 50 µm.

