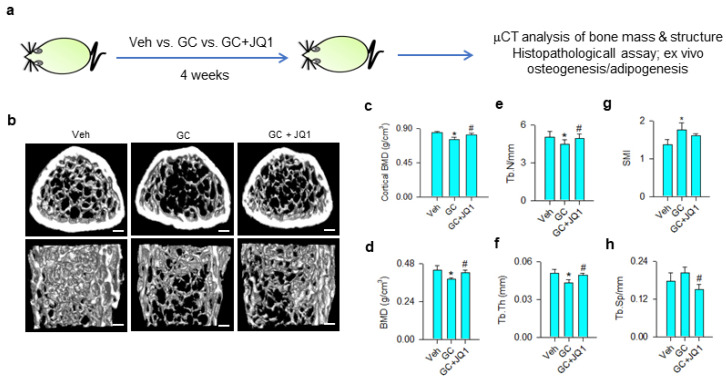
Figure 6.
μCT analyses of bone mass and microstructure of glucocorticoid- and JQ-1-treated mice. Schematic drawing for administration with glucocorticoid and JQ-1 (a). Glucocorticoid-treated bone tissue showed poor trabecular bone microarchitecture, whereas mild bone loss was present in the GC + JQ-1 group (b); Scale bar, 5 mm. JQ-1 treatment attenuated glucocorticoid-mediated loss of cortical BMD (c), trabecular BMD (d), Tb.N (e), and Tb.Th (f). SMI were increased in the glucocorticoid-treated group (g), whereas Tb.Sp were decreased in the GC + JQ-1 group (h). Bone mass and microarchitecture were probed using the Skyscan 1176 μCT system together with SKYSCAN® CT-Analysis software. Data are expressed mean ± SEM calculated from 6 mice. Asterisks * indicate significant differences from the vehicle group and hashtag # indicates significant differences from the GC group (p < 0.05). GC: glucocorticoid; Veh: vehicle.

