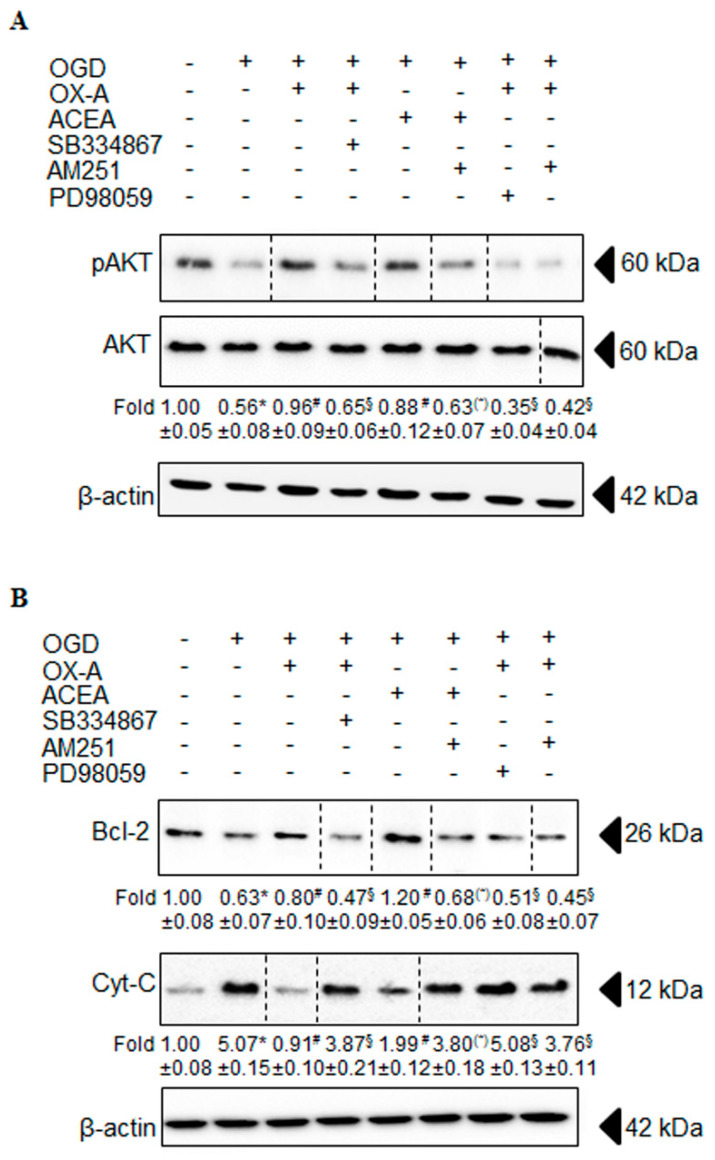
Figure 6.
Effect of OX-A or ACEA on OGD-induced apoptosis in primary cortical neurons. (A) Neurons were incubated with AM251 (0.5 µM), SB 334867 (10 µM) or PD98059 (50 µM) for 15 min, exposed to OX-A (0.2 µM) for an additional 30 min and, finally, subjected to OGD for 60 min. The cells returned to the incubator under normoxic conditions for 20 h prior to analyzing the total cell extract with Western blotting using anti-phospho-Akt serine 473 or AKT antibodies. Fold data represent the mean ± SEM of three separate experiments, each performed in duplicate, normalized to the total proteins present in the extract of control cells. (B) Cells, treated as in (A), returned to the incubator under normoxic conditions for 20 h prior to isolating the mitochondrial and cytosolic fractions. Cytosolic fractions were finally processed for Western blot analysis using cytochrome c or Bcl-2 antibodies. Fold data represent the mean ± SEM of three separate experiments, each performed in duplicate, normalized to the total proteins present in the cytosolic fractions of control cells. Blots shown are representative of three separate experiments with similar outcomes. The β-actin bands confirm that similar amounts of proteins were loaded on the gel for each sample. * p < 0.01 vs. untreated cells; # p < 0.01 vs. OGD-treated cells; § p < 0.01 vs. OGD/OX-A-treated cells; (*) p < 0.01 vs. OGD/ACEA-treated cells (one-way ANOVA followed by Bonferroni test).

