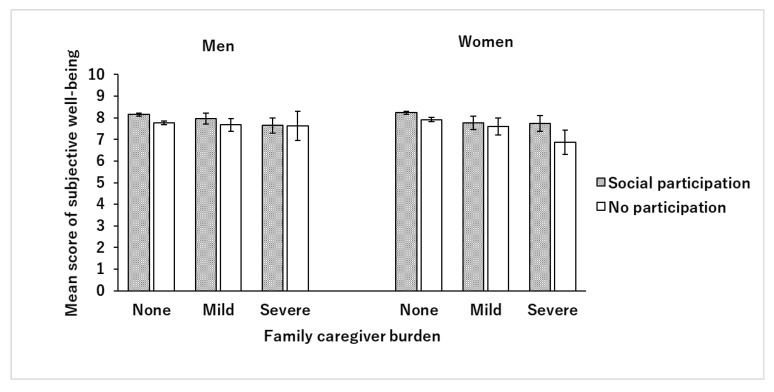
Figure 1.
Mean scores of subjective well-being stratified by social participation of family caregivers. The bars in the figure show the mean subjective well-being scores, and the error bars show 95% confidence intervals. Gray bars indicate the scores of those with social participation, and white bars indicate the scores of those without social participation. The figure demonstrates that the higher caregiver burden, the lower the subjective well-being score, in both men and women. In male participants, the trend was almost the same regardless of social participation, while in female participants, in contrast with those with social participation, those with no participation had significantly lower subjective well-being scores when caregiver burden increased.

