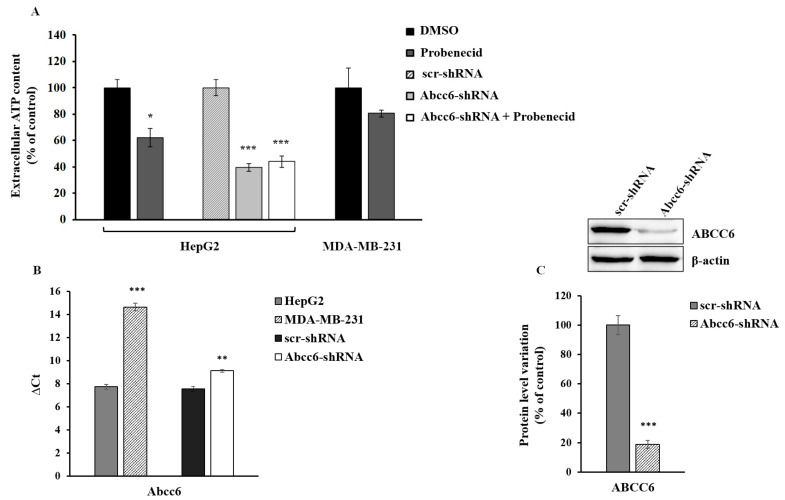
Figure 1.
Extracellular ATP content. (A) HepG2 and MDA-MB-231 cells were treated with 250 μM probenecid or 0.25% DMSO for 48 h. Results are expressed as the mean ± standard error (ES) of three different experiments. * p < 0.05 Probenecid vs. DMSO, *** p < 0.001 Abcc6-shRNA and Abcc6-shRNA + Probenecid vs. scr-shRNA (B) Abcc6 gene expression in HepG2, Abcc6-shRNA HepG2 and MDA-MB-231 cells. Gene expression was normalized to β-actin mRNA levels. *** p < 0.001 MDA-MB-231 cells vs. HepG2 cells, ** p < 0.01 Abcc6-shRNA HepG2 cells vs. scrambled HepG2 cells; (C) Representative western blot of Abcc6-shRNA HepG2 cells. Densitometric analysis of the immunoreactive bands performed in five independent experiments. The protein levels were normalized with β-actin content. Data were normalized to scrambled cells set to 100%. Data are shown as the mean ± standard error (SE) *** p < 0.001 Abcc6-shRNA HepG2 cells vs. scr-shRNA HepG2 cells.

