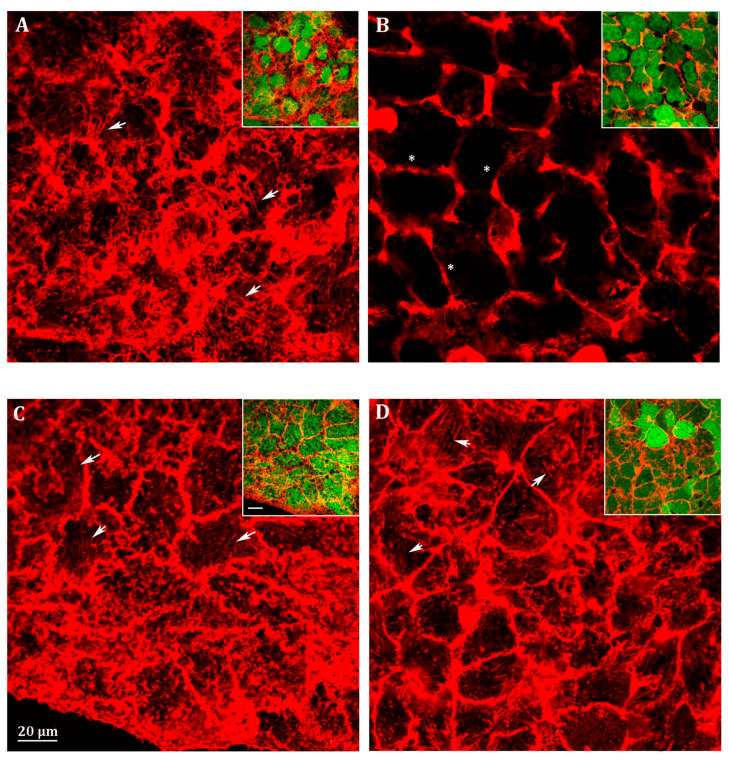
Figure 4.
Representative confocal image of (A) scrambled HepG2 cells; (B) Abcc6-shRNA HepG2 cells; (C) Abcc6-shRNA HepG2 cells treated with 500 µM ATP; (D) Abcc6-shRNA HepG2 cells treated with 100 µM adenosine. F-actin was stained with Phalloidin Alexa Fluor 568. In the insets, superposition of cytoskeleton (red) and EGFP (green) to monitor the infection efficiency. The scale bar in the enlarged figure: 40 µm.

