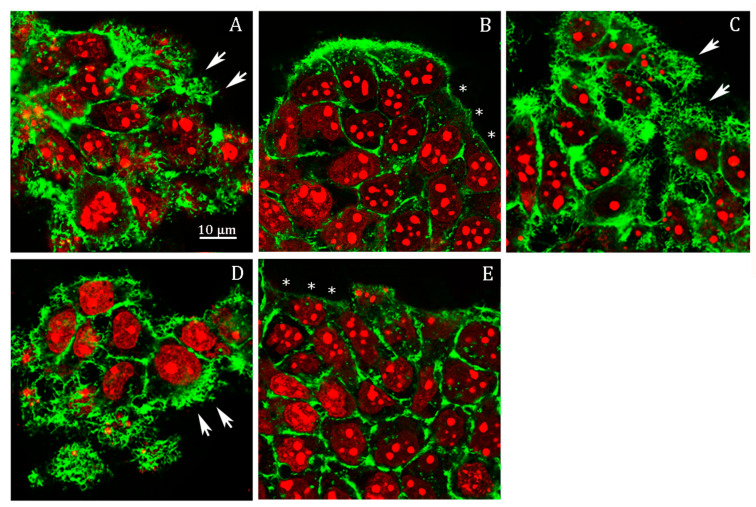
Figure 5.
Representative confocal image of HepG2 cells treated with (A) 0.25% DMSO (vehicle) for 48 h; (B) 250 µM probenecid for 48 h; (C) 250 µM probenecid and 500 µM ATP for 48 h; (D) 250 µM probenecid and 100 µM adenosine for 48 h; (E) 50 µM AOPCP for 48 h. F-actin and nuclei were stained with Phalloidin Alexa Fluor 488 and propidium iodide, respectively.

