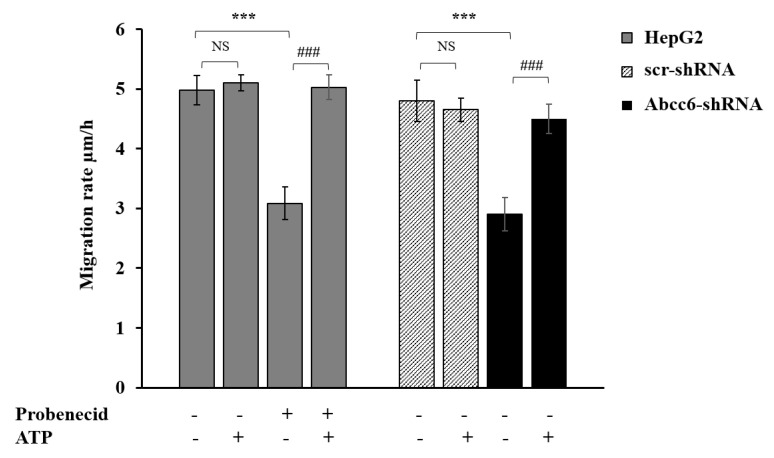
Figure 7.
Effect of probenecid and Abcc6 silencing on the migration rate of HepG2 cells. Cells were treated with 250 μM probenecid for 48 h (gray plain bars, Probenecid+). DMSO-treated cells were used as the control (gray plain bars, Probenecid−). A total of 500 µM ATP was added to either the control cells (gray plain bars, Probenecid−, ATP+) or to probenecid-treated cells (gray plain bars, Probenecid+, ATP+). HepG2 cells were transduced with scrambled shRNA (grey-texturized bars, scr-shRNA) or with specific Abcc6-shRNA (black bars, Abcc6-shRNA). A sample of 500 µM ATP was added to either control cells (grey-texturized bars, scr-shRNA, ATP+) or to Abcc6 silenced cells (black bars, Abcc6-shRNA, ATP+). Data are expressed as mean ± standard error (SE) of three replicates from three independent experiments. Data were analyzed by one-way ANOVA followed by Dunnett’s post hoc test using GraphPad Prism 7 software, *** p < 0.001 probenecid treated cells (gray plain bars, Probenecid+) vs. control cells (gray plain bars, Probenecid−) in the absence of ATP (ATP−); Abcc6-shRNA (black bars, Abcc6-shRNA) vs. scr-shRNA (grey-texturized bars, scr-shRNA) in the absence of ATP (ATP−). ### p < 0.001 probenecid + ATP treated HepG2 cells (gray plain bars, Probenecid+, ATP+) vs. probenecid treated HepG2 cells (gray plain bars, Probenecid+, ATP−); Abcc6-shRNA cells+ ATP (black bars, Abcc6-shRNA, ATP+) vs. Abcc6-shRNA cells (black bars, Abcc6-shRNA, ATP−). NS, not significant.

