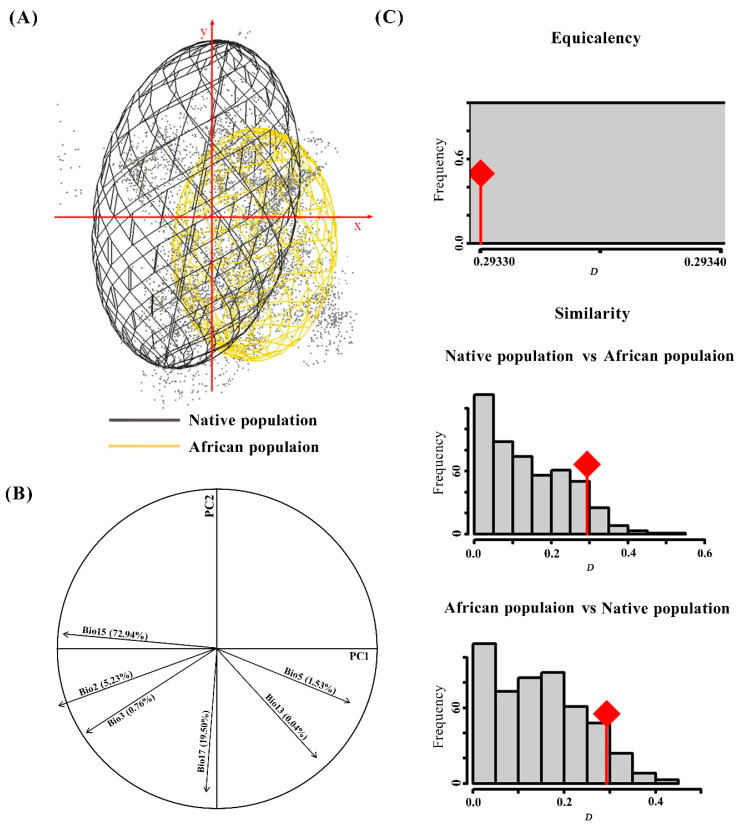
Figure 2.
Comparison of Spodoptera frugiperda populations between native and Africa. (A) Occurrences in a two-dimensional environmental space; axes are the first two principal components; and gray points are the environmental background of the study area. (B) The contribution of the climatic variables on the two axes of the PCA and the percentage of each variable. (C) Histogram of the niche equivalency and niche similarity tests between native and Africa ranges. The D stands for Schoener’s D overlap value, red lines with a diamond represent the observed niche overlap, and gray bars represent simulated niche overlaps.

