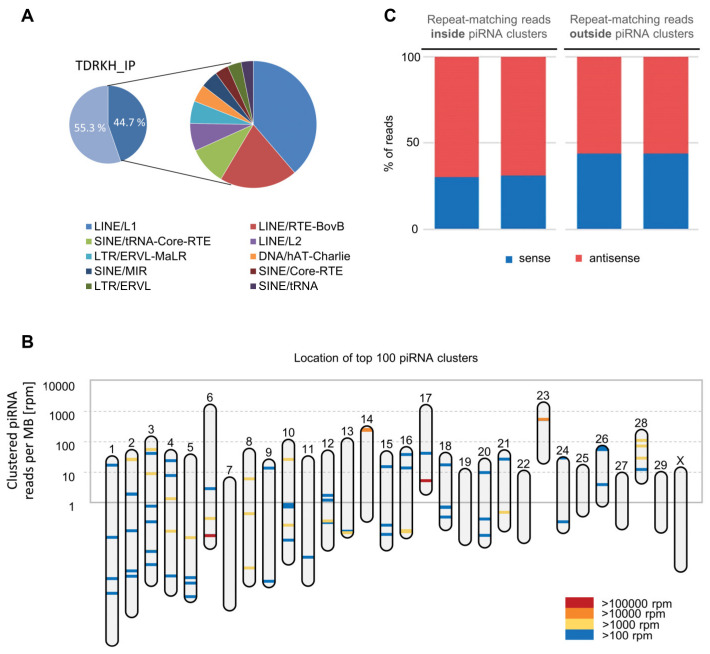
Figure 6.
piRNAs mapping to transposons. (A) Pie chart depicting the transposon content (dark blue) of bovine piRNA populations from TDRKH IP samples, with further annotation in inset. (B) Mapping of piRNA clusters across chromosomes in the Bos taurus genome. Each piRNA cluster location is indicated by a bar colored according to its expression level. Y-axis refers to the number of clustered piRNAs per chromosome, normalized by chromosome size. (C) Repeat-matching reads inside and outside piRNA clusters in TDRKH IP samples.

