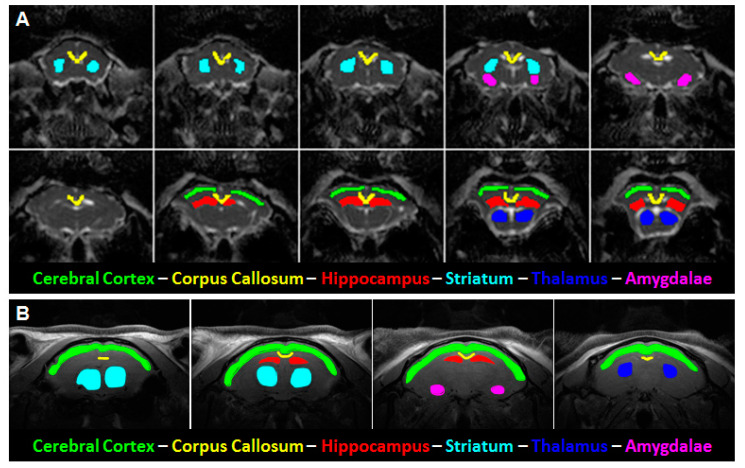
Figure 1.
Representative mean diffusivity (MD) and T2-weighed images with delineated regions of interest (ROIs). (A) ROIs used for diffusion tensor imaging (DTI) and diffusion kurtosis (DKI) analyses were manually outlined on the MD image. (B) ROIs used for T2 relaxometry were manually outlined on a matching T2 image (left, showing cortical ROI). The slope of the ROI intensity over multiple echo times (TE) within the image was automatically plotted and fitted to arrive at the calculated T2 relaxation time.

