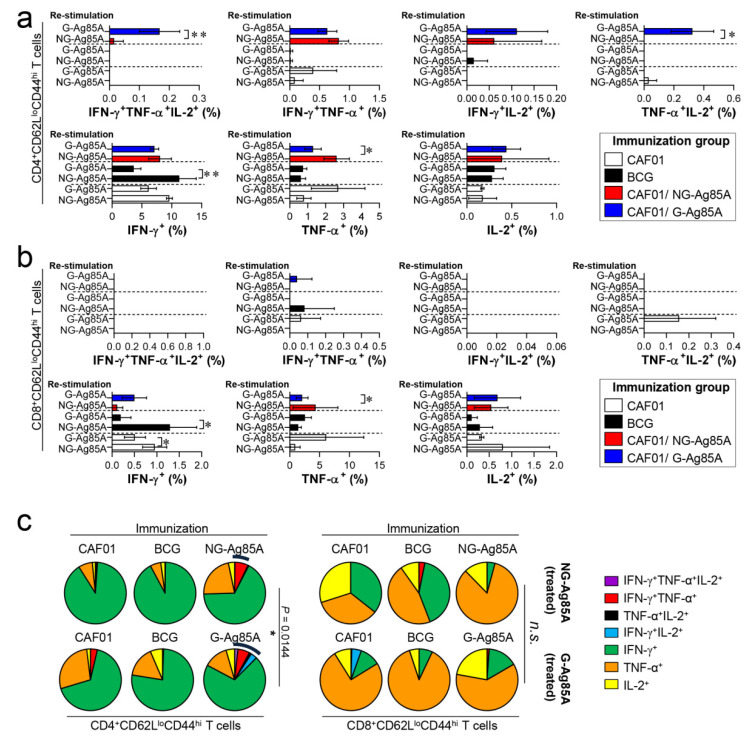
Figure 4.
Comparison of the induction of Ag-specific multifunctional T cells in mice immunized with plant-produced G-Ag85A and bacteria-produced NG-Ag85A. Four weeks after the final immunization, the mice from each group were sacrificed, and their lung cells (1 × 10⁶ cells) were restimulated ex vivo with NG-Ag85A or G-Ag85A (2.5 μg/mL). The percentages of Ag-specific CD4+CD62LloCD44hi and CD8+CD62LloCD44hi T cells producing IFN-γ, TNF-α, and/or IL-2 among the cells isolated from the lungs of each group of mice were analyzed via flow cytometry by gating the cells into CD4+ (a) and CD8+ (b) T cells. The data are presented as the mean ± SDs from 5–6 mice in each group. One-way ANOVA was used to determine the significance of the differences. * p < 0.05, ** p < 0.01, and *** p < 0.001. (c) The mean frequencies of cells coexpressing IFN-γ, TNF-α, and/or IL-2 are shown in the pie charts. The arcs around the pie charts indicate the percentage of T cells that produced multiple cytokines. Unpaired t-tests were used to determine the significance of the differences in the percentages of polyfunctional T cells between the G-Ag85A- and NG-Ag85A-immunized groups.

