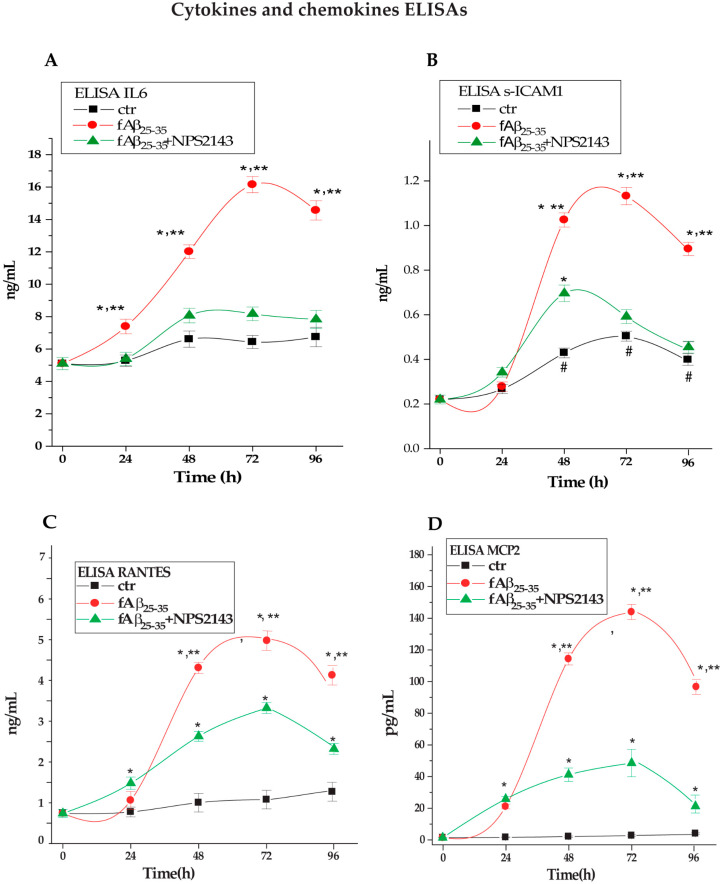
Figure 3.
Changes in released levels of (A) IL-6, (B) s-ICAM-1, (C) RANTES, and (D) MCP-2 in NAHAs treated with fAβ25–35 ± NPS 2143 vs. untreated controls (CTR). Each agent was assessed in the NAHA-conditioned media via a specific ELISA kit as detailed in the Materials and Methods. Points on the curves are means ± SEMs of 3–5 independent experiments, each carried out in duplicate. One-way ANOVA followed by post hoc Tukey’s test allowed us to calculate p values. * p < 0.05 vs. time-corresponding CTR values; # p < 0.05 vs. 0-h CTR value; ** p < 0.05 vs. fAβ25–35 + NPS 2143 values.

