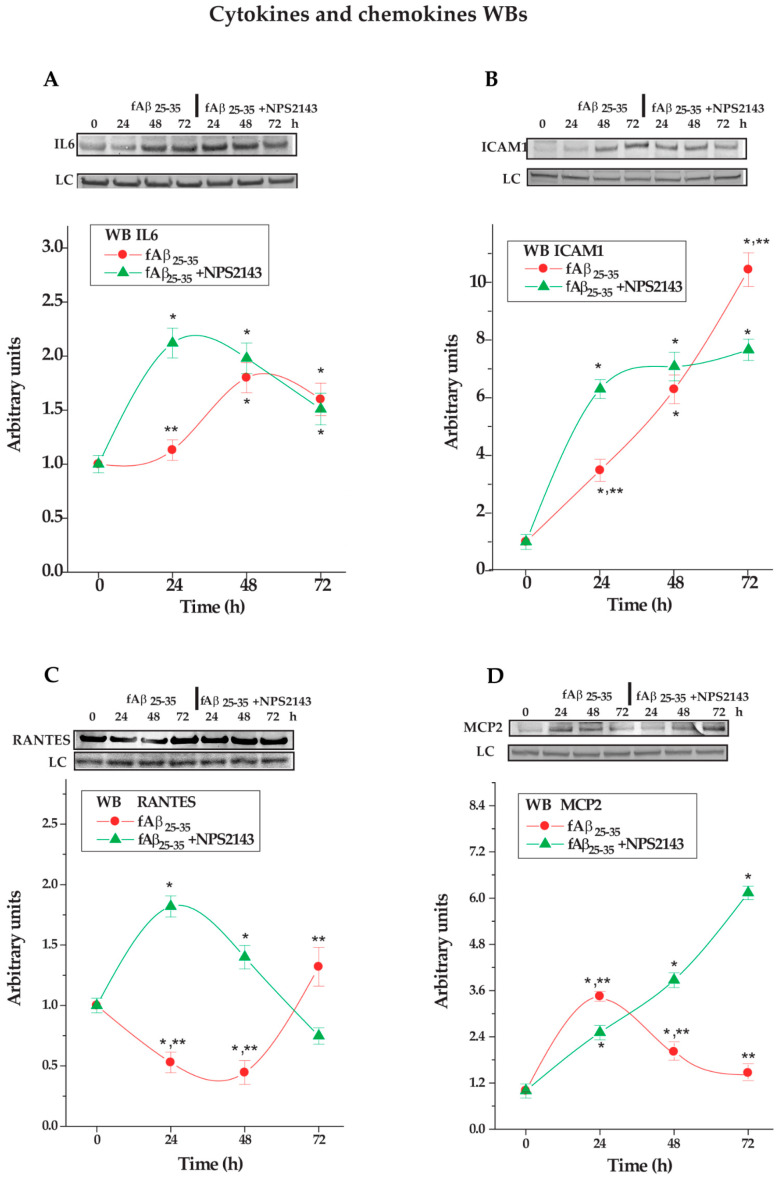
Figure 4.
Changes in protein lysates’ levels of (A) IL-6, (B) s-ICAM-1, (C) RANTES, and (D) MCP-2 in NAHAs treated with fAβ25–35 ± NPS 2143 vs. untreated controls (CTR). At the top of each panel are typical immunoblots showing the densitometric changes of each agent according to treatments vs. untreated controls (CTR). LC, loading control. The graphs underneath show the densitometric evaluations of the specific bands at each time point of every treatment. Points on the curves are mean values of three independent experiments, each carried out in duplicate with control (0-h) values normalized as 1.0. One-way ANOVA followed by post hoc Tukey’s test allowed to calculate p values. * p < 0.05 vs. CTR; ** p < 0.05 vs. fAβ25–35 + NPS 2143.

