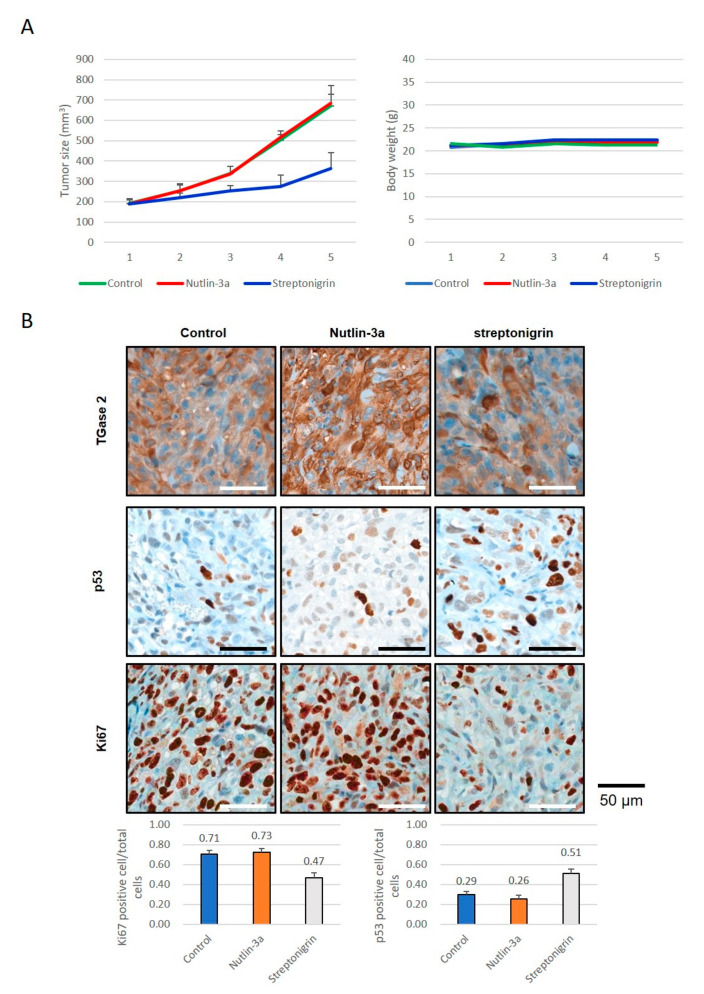
Figure 4.
The anticancer effects of inhibition of TGase 2 and MDM2 in a human RCC xenograft model: (A) ACHN cells were injected subcutaneously into one flank of BALB/c nude mice (n = 5). Mice received streptonigrin or nutlin-3a when tumors reached a volume of 200 mm3. The average tumor volume and body weight is presented as the mean ± SE. (B) ACHN cells harvested from BALB/c nude mice were analyzed by immunohistochemical staining for Ki67, TGase 2, and p53. The bar graph represents the percentage of cells positive for Ki67 or p53. Cumulative data from three independent experiments are shown (mean ± SD; n = 3). **p < 0.01 and ***p < 0.001.

