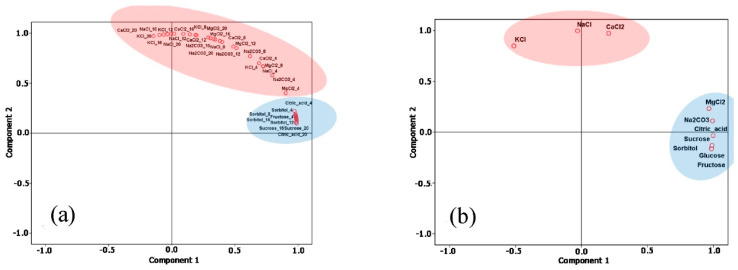
Figure 10.
Discrimination between sugars and organic acid (blue oval) and salts (red ovals) using principal component analysis (PCA). (a): magnitudes of the transmission coefficient (S21) between 2.3 and 2.6 GHz; (b): amplitude of S21 at the resonance frequency. Reproduced with permission from [57] © Elsevier.

