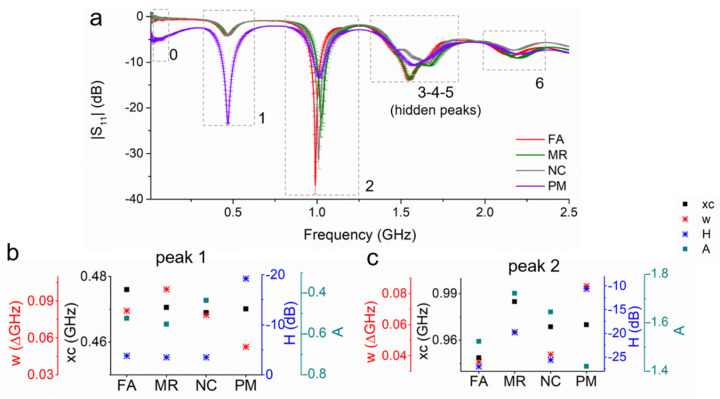
Figure 14.
(a) Microwave spectral output for four polluted mining-impacted water samples collected in Wales (UK) analysed with an f-EM sensor based on L-CyCHBCZ coating and (b) peak parameters (w, xc, H and A) comparison for peaks 1 and (c) 2. Reproduced from [74], Creative Commons Attribution 4.0 International License.

