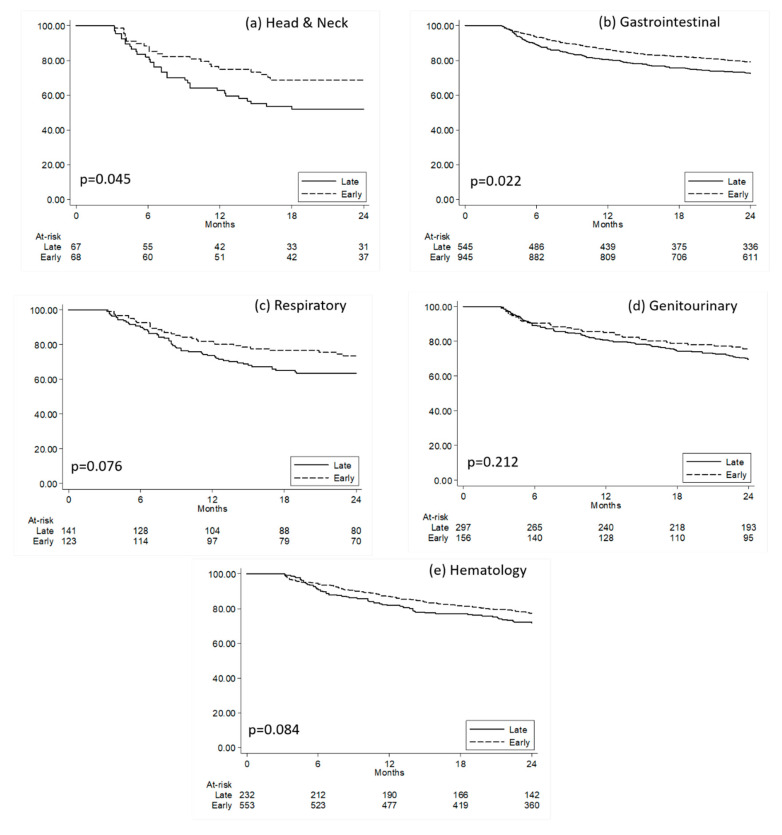
Figure 3.
Kaplan–Meier curves comparing survival time since cancer diagnosis for non-metastatic patients with early versus late clinical nutrition. (a) Head and Neck; (b) Gastrointestinal, (c) Respiratory, (d) Genitourinary, (e) Hematology. Quartiles of time (months) since cancer diagnosis to the first clinical nutrition prescription was calculated in all non-metastatic patients receiving clinical nutrition; patients were then classified as having early or late administration when presenting a time since diagnosis to clinical nutrition administration below or above the first quartile, respectively. P: p-values from Log-Rank Tests.

