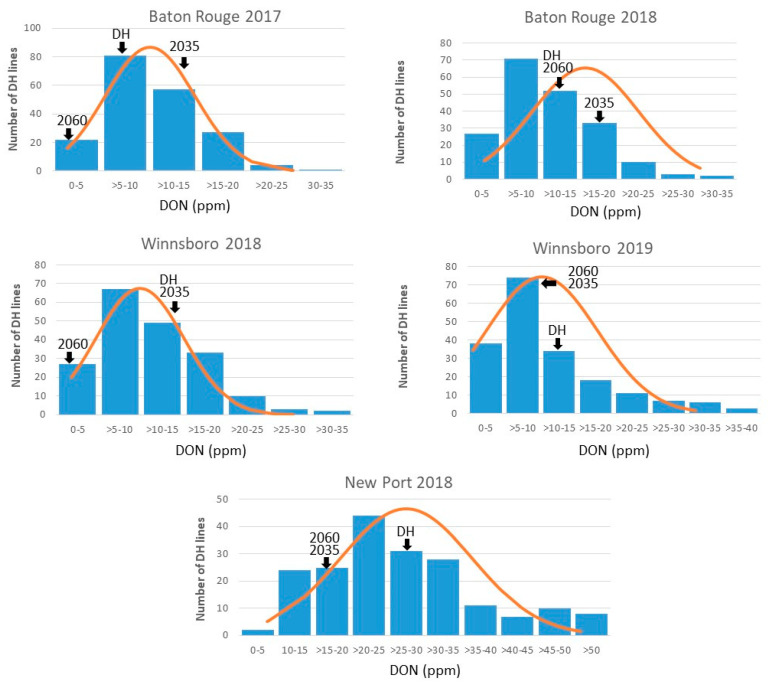
Figure 1.
Phenotypic distribution of deoxynivalenol (DON) concentration for field trials in Baton Rouge, LA during 2017 and 2018; Winnsboro, LA during 2018 and 2019; Newport, AR during 2018. Parental and population means are marked by arrows. 2060, 2035, and DH represent mean values for AGS 2060, AGS 2035, and DH population, respectively. The normality of the data was tested using the Shapiro–Wilk test in R. Distribution was considered near-normal when p-values were less than but close to 0.05.

