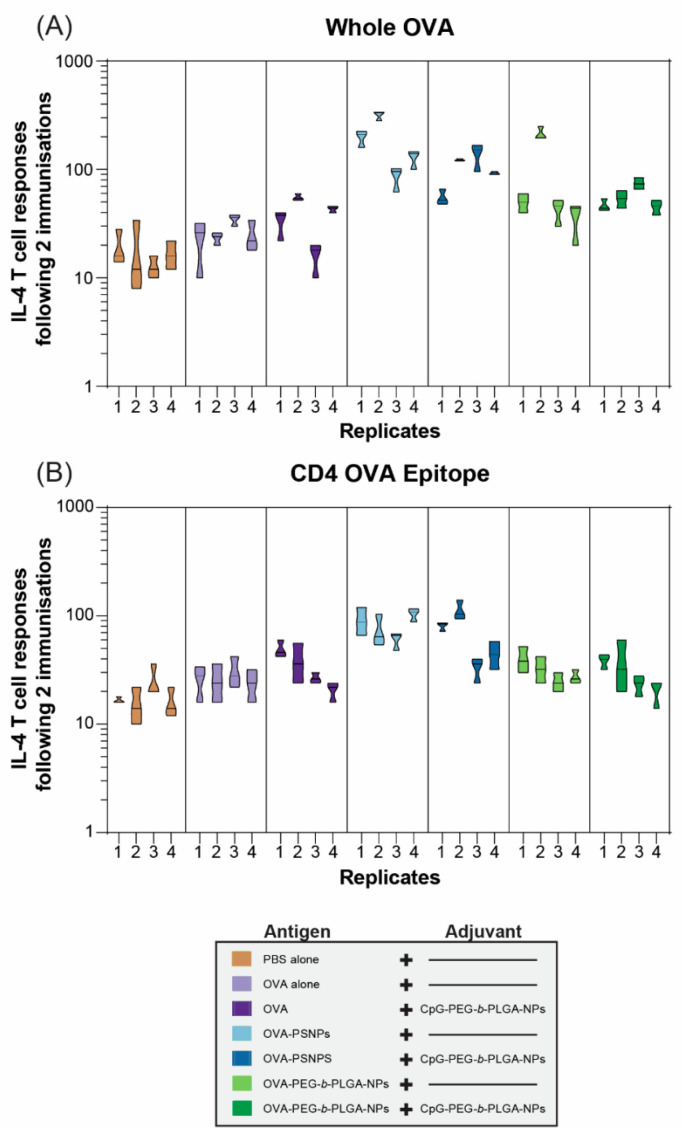
Figure 3.
Interleukin 4 (IL-4) T-cell responses to nanovaccine formulations at day 28. C57BL/6 mice were immunized twice, two weeks apart, intradermally at the base of the tail with the following formulations; phosphate buffered saline (PBS) alone (Naïve), OVA alone, OVA + CpG-PEG-b-PLGA NPs, OVA-PS NPs, OVA-PS NPs + CpG-PEG-b-PLGA NPs, OVA-PEG-b-PLGA NPs, or OVA-PEG-b-PLGA NPs + CpG-PEG-b-PLGA NPs. All animals received 50 µg OVA. CpG-PEG-b-PLGA groups received 5 µg CpG. Graph shows IL-4 T-cell responses to (A) whole OVA and the (B) CD4+ T-helper OVA epitope by ELISpot assay. Individual mice (replicates 1–4 for control and treatment groups) are shown for each recall antigen ± experimental error from triplicate assay wells.

