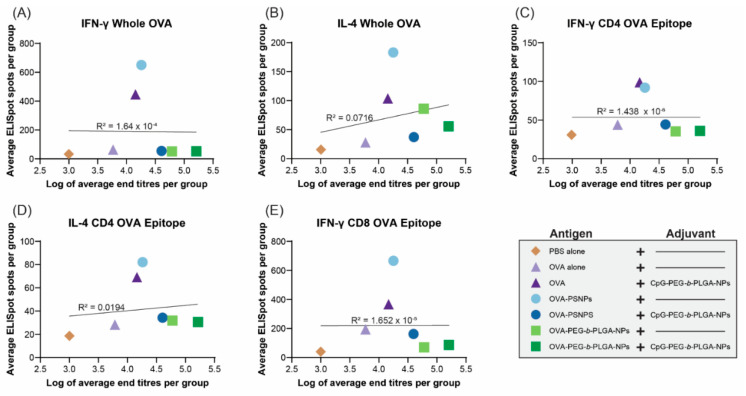
Figure 5.
Correlations between cytokine levels and antibody end titers at day 28. C57BL/6 mice were immunized twice, two weeks apart, intradermally at the base of the tail with the following formulations; PBS alone (Naïve), OVA alone, OVA + CpG-PEG-b-PLGA NPs, OVA-PS NPs, OVA-PS NPs + CpG-PEG-b-PLGA NPs, OVA-PEG-b-PLGA NPs, or OVA-PEG-b-PLGA NPs + CpG-PEG-b-PLGA NPs. All animals received 50 µg OVA. CpG-PEG-b-PLGA NP groups received 5 µg CpG. Graphs show linear regression correlations between average antibody end titer (log) and the average number of IFN-γ and IL-4 producing cells from each group to (A,B) whole OVA, (C,D) CD4+ T-helper OVA epitope (ISQAVHAAHAEINEAGR), and (E) CD8+ cytotoxic T-cell OVA epitope (SIINFEKL).

