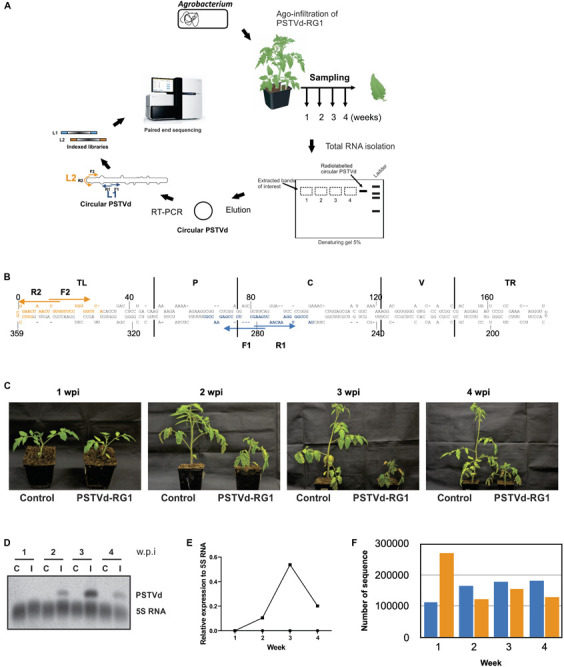
FIGURE 2.

Experimental strategy and analysis of the viroids recovered from the PSTVd-RG1 infected tomato plants. (A) Flow diagram outlining the steps involved in the infection assay, sample preparation and viroid high-throughput sequencing from the PSTVd-RG1 infection in tomato plants. Agrobacterium tumefaciens (A. tumefaciens) strain GV3101 was transformed with recombinant binary vector pBIN61 containing the dimeric construct of PSTVd-RG1. Primary leaves of tomato plants (cv. Rutgers) which were maintained in a chamber were agro-infiltrated with the transformed A. tumefaciens. Plants inoculated with empty vector were used for mock infection. Total RNA was extracted from the upper, non-inoculated leaf samples which were harvested at 1–4- weeks post-infection (wpi). After verifying the presence of PSTVd, circular PSTVd (cPSTVd) was isolated through polyacrylamide gel electrophoresis under denaturing conditions. Purified cPSTVd RNA was amplified by RT-PCR using two distinct sets of primers binding at different locations on the PSTVd molecule to construct two libraries namely, Library 1 (L1) and Library 2 (L2). The resulting 8 libraries (2 libraries per week × 4 weeks) were indexed and sequenced using the Illumina MiSeq sequencer. (B) Nucleotide sequence and secondary structure of PSTVd-RG1. The region spanning the primers used for amplification are shown in blue and orange, respectively, for libraries 1 and 2 (i.e., L1 and L2). The arrows indicate the primer binding sites in the 5′–3′ orientation. The structural/functional domains of PSTVd: Terminal left (TL), Pathogenicity (P), Central (C), Variable (V), and Terminal right (TR), are delimited by the vertical solid lines and are named accordingly. (C) Photos of tomato plants agroinfiltrated at the two leaf stage with Agrobacterium harboring, or not (control), a plasmid including a dimeric head-to-tail construct of PSTVd-RG1. (D) Autoradiogram of a RNA-gel blot hybridization for the detection of PSTVd and the 5S RNA (as loading control) in PSTVd-infected tomato plants. (E) Relative expression level of PSTVd compared to that of 5S rRNA. (F) Histogram of the total number of full-length PSTVd reads obtained by high-throughput sequencing for both the L1 (blue color) and the L2 (orange color) libraries.
