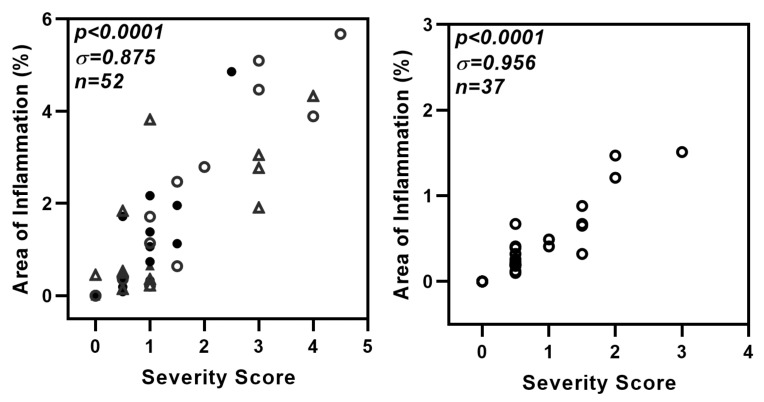
Figure A3.
Strong correlation between two methods used for the evaluation of lung inflammation. The hematoxylin and eosin-stained lung sections (used in Figure 3e and Figure 7e) were also evaluated manually for severity of lung inflammation by an observer blinded to the experimental details. Lung pathology was evaluated for extent of airway and parenchymal involvement and severity of lymphocytic infiltration. The inflammation was scored on a scale of 0–5 with 0 = no inflammation and 1–5 representing increasing severity. A strong correlation is seen between data presented as % area of inflammation versus severity score. Left panel: comparison for data in Figure 3e. (△ and ○: DMXAA-treated at one and two months respectively; ▲ and ●: Vehicle-treated at one and two months respectively.) Right panel: comparison for data in Figure 7e (Each circle (○) represents data point from one mouse).

