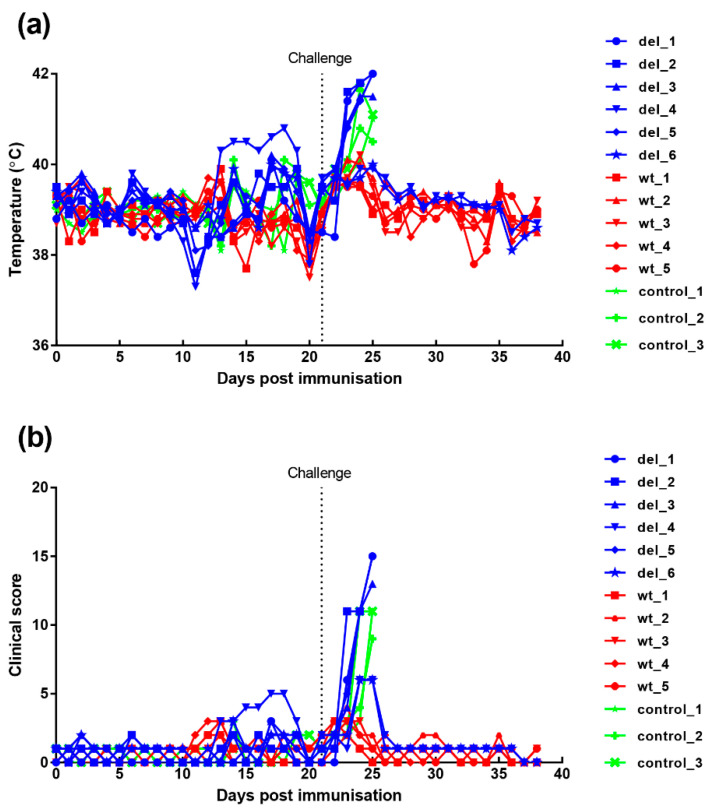
Figure 4.
Clinical scores and temperatures of pigs following immunisation with OURT88/3 or OURT88/3ΔI329L and challenge with virulent virus. Panel (a) shows temperatures and panel (b) scores all clinical signs on the y-axis. Days post-immunisation are shown on the x-axis. The blue symbols and signs show those pigs immunised with the OURT88/3ΔI329L virus (del_1–6) and red with OURT88/3 (wt_1–5). Information on the control pigs is shown in green (control_1–3).

