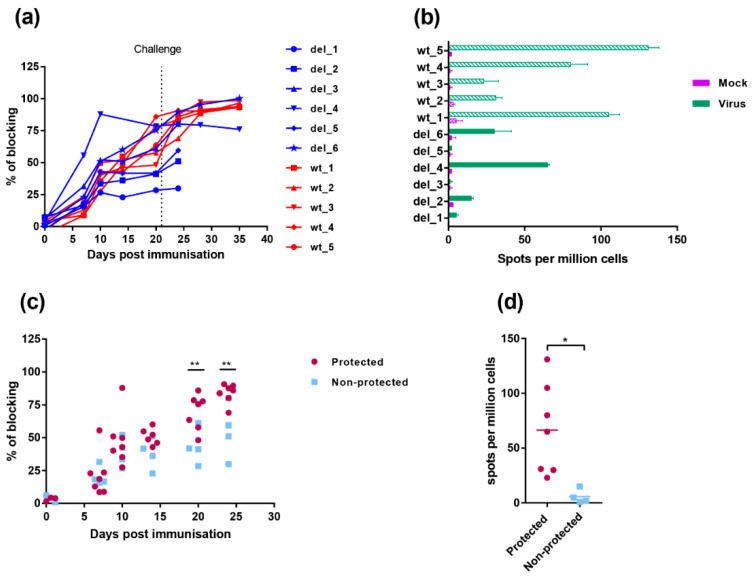
Figure 7.
Immune responses in pigs immunised with OURT88/3 and OURT88/3ΔI329L. Panel (a) shows anti-ASFV antibodies detected by a blocking ELISA at different days post-immunisation. The y-axis shows the percentage of blocking, and the x-axis shows days post-immunisation. The results for pigs immunised with OURT88/3 are shown in red (wt_1–5), with OURT88/3ΔI329L in blue (del_1–6). Panel (c) compares antibody response in pigs that survived challenge (protected, magenta) with those that did not survive (non-protected blue). Panel (b) shows the numbers of IFN-γ-producing cells detected by ELIspot assay following the stimulation of lymphocytes with ASFV. The x-axis shows IFN-γ-producing cells (spots) per million of cells detected, and the y-axis shows the source of samples. The results from mock-treated (purple) and ASFV-stimulated lymphocytes (green) are shown. Panel (d) compares numbers of IFN-γ-producing cells detected in protected versus non-protected pigs. Asterisks indicate statistically significant differences between groups (* p ≤ 0.05; ** p ≤ 0.01).

