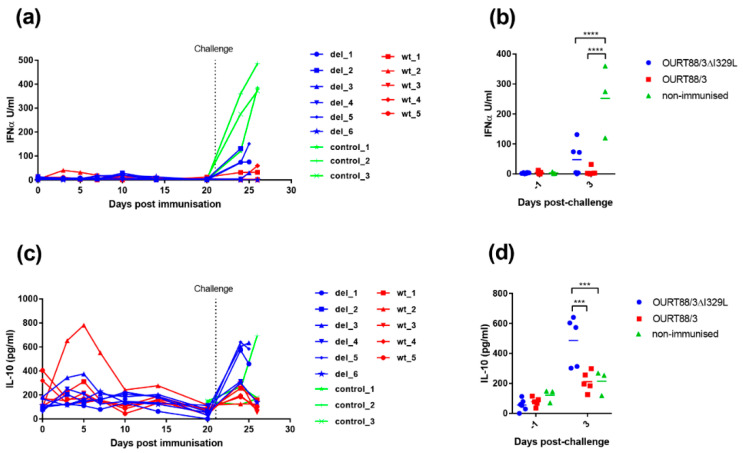
Figure 8.
Detection of IL-10 and IFN-α in sera from pigs after immunisation and challenge. Panel (a) shows IFN-α and panel (c) IL-10 detected in serum at different days post-immunisation. The y-axis shows the amount detected in Units per ml, and the x-axis shows the days post-immunisation. The results for pigs immunised with OURT88/3 are shown in red (wt_1–5), with OURT88/3ΔI329L in blue (del_1–6) and control pigs in green (control_1–3). Panels (b,d) show the results post-challenge analysed to determine statistical differences between groups. Asterisks indicate statistically significant differences between groups (*** p ≤ 0.001; **** p ≤ 0.0001).

