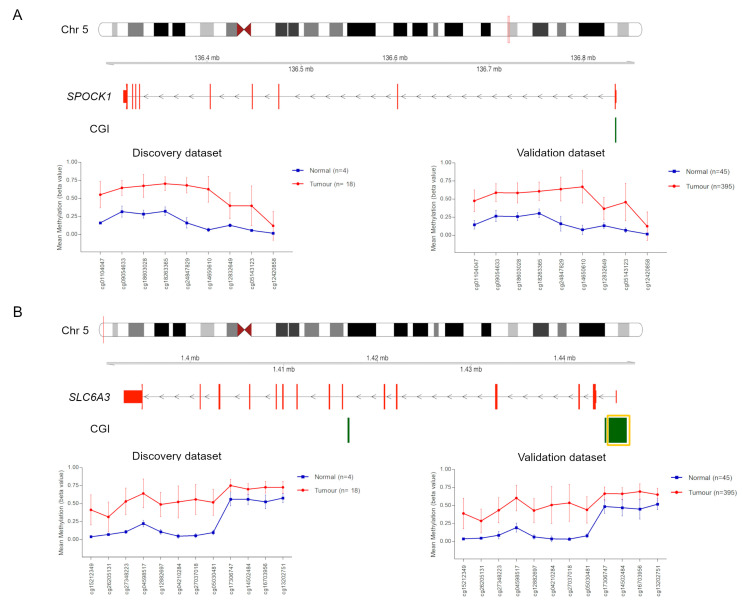
Figure 2.
Methylation values obtained from our CRC discovery set and TCGA validation set. Genomic organization of SPOCK1 (A) and SLC6A3 (B), including the localization of exons and CGIs. Mean β values, resulting from the average of the samples (normal and tumour) of each probe mapping on the altered CGIs associated with SPOCK1 (A) and SLC6A3 (B). When more than one CGI is shown, the altered one is enclosed in a yellow box.

