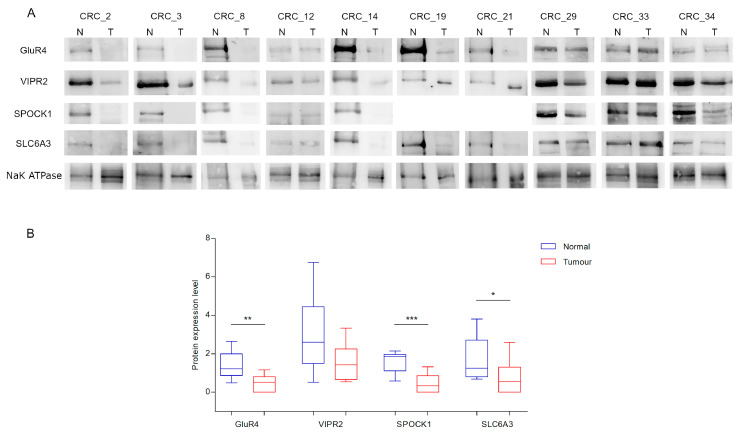
Figure 5.
Protein expression level for each paired sample. (A) Representative blots of GluR4, VIPR2, SPOCK1 and SLC6A3 protein expression in 10 CRC paired tissues samples. NaK ATPase was used as loading control. (B) Box plots of GluR4, VIPR2, SPOCK1 and SLC6A3 expression. Asterisks indicate statistically significant differences (* p value < 0.05, ** p value < 0.01, *** p value < 0.001). For the SPOCK1 expression study, there was not enough protein lysate for samples 19 and 21.

