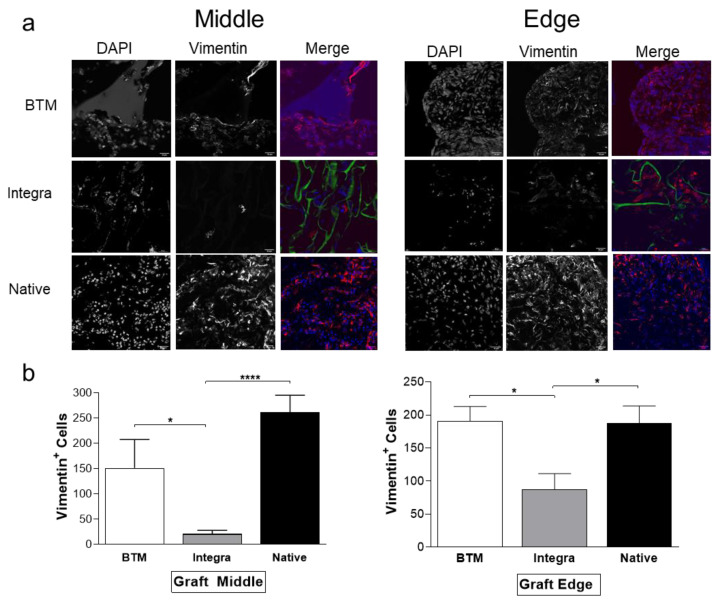
Figure 2.
Mesenchymal host infiltration in mouse grafts. (a) Fibroblasts were detected by confocal microscopy using a vimentin antibody (in red) and DAPI (in blue). Dermal template autofluorescence is shown in green (scale bar 50 µm). (b) Vimentin positive cells were quantified on NIS Analysis software (Nikon, Japan) in six fields of view (n = 4–6 mice per group). Values represent mean +/− SEM in each group and analysed using unpaired t-test. * = p ≤ 0.05, **** = p < 0.0001.

