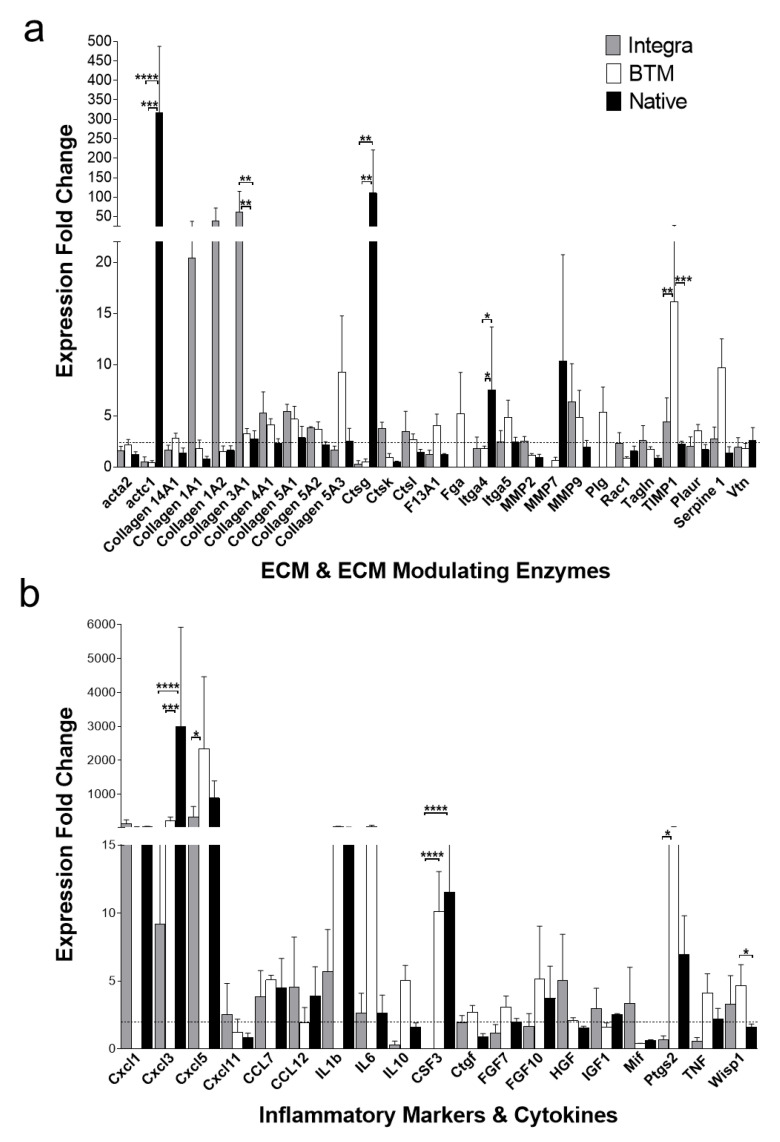
Figure 3.
RNA expression profiling (mouse wound healing RT2 profiler PCR array) of 2-week-long grafts. (a) Upregulated ECM structural and modifying enzyme genes identified in grafts by Ct comparison with host RNA. (b) Upregulated inflammation markers, including cytokines and chemokines. Selected targets produced an average of >2-fold change in at least one of the studied groups. Mean and SEM values presented for each group (n = 3 per group). * = p < 0.05, ** = p < 0.01, *** = p < 0.001, **** = p < 0.0001). A heatmap of all arrayed genes is available in Supplementary Data Figure S2.

