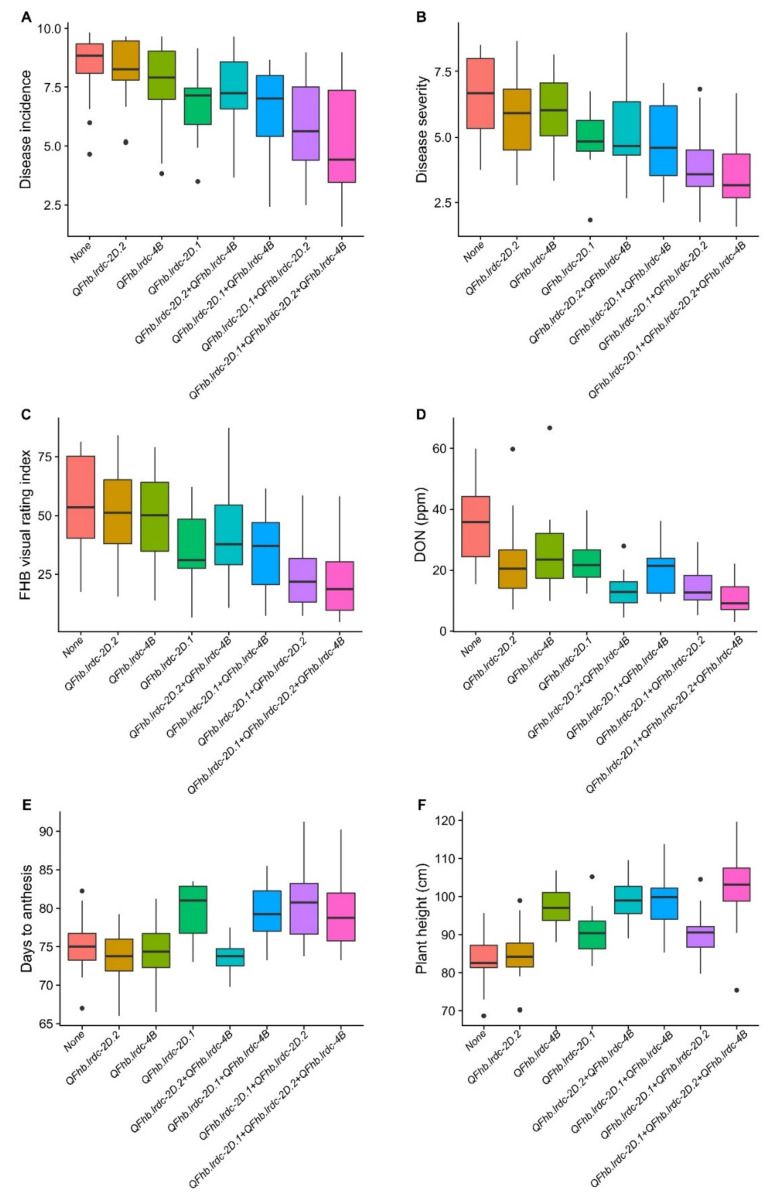
Figure 3.
Boxplot distributions of doubled haploid (DH) population produced from the cross AAC Innova x AAC Tenacious. Effects of positive alleles of single QTL (QFhb.lrdc-2D.1, QFhb.lrdc-2D.2 and QFhb.lrdc-4B) and their combinations on average Fusarium head blight incidence (A), severity (B), visual rating index (C), deoxynivalenol (DON) accumulation (D), days to anthesis (E) and plant height (F) are depicted alongside negative alleles at all three loci using pooled phenotypic data (average of all environments). Quartiles and medians are represented by boxes and continuous lines, respectively. Whiskers extend to the farthest points that are not outliers, whilst outliers are shown as black dots.

