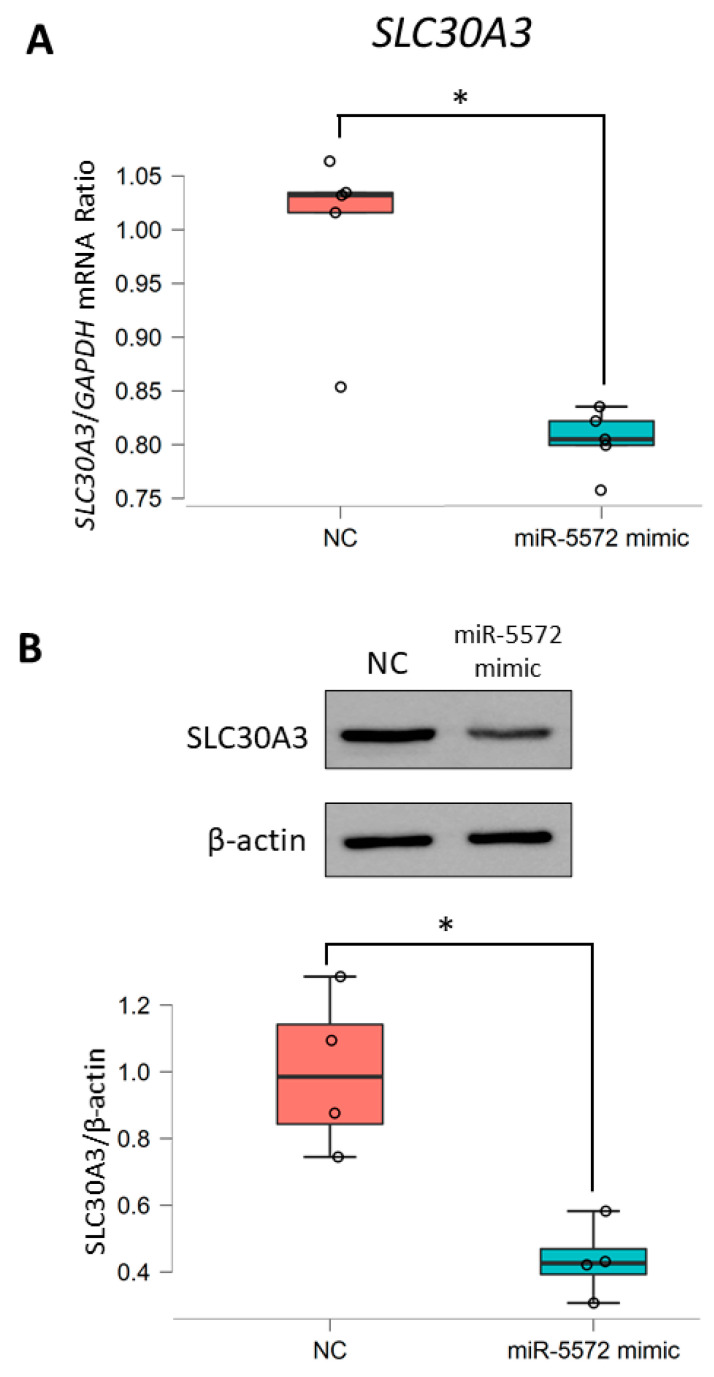
Figure 3.
Determination of regulation of miR-5572 on SLC30A3 expression. (A) The level of SLC30A3 mRNA was determined in HEK293 cells transfected with negative control (NC) (n = 5) and miR-5572 mimic (n = 5) by real-time RT-PCR analysis. All data are presented as box and scatter plot. Statistical significance was determined by Student’s t-test (* p < 0.05). (B) The level of SLC30A3 protein was determined in HEK293 cells transfected with NC (n = 4) or miR-5572 mimic (n = 4) by Western blotting analysis. All data are presented as box and scatter plot. Statistical significance was determined by Student’s t-test (* p < 0.05).

