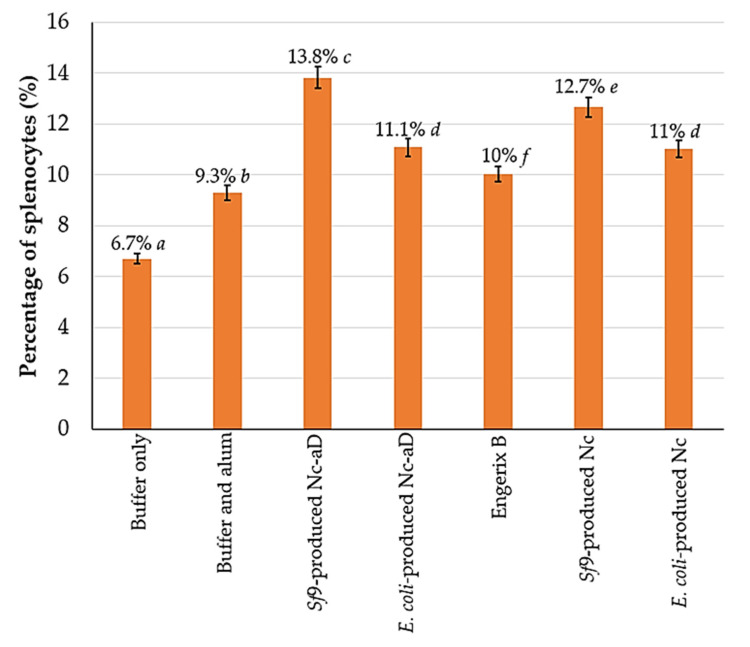
Figure 4.
Frequency of NK1.1+ mouse splenocytes. Splenocytes from mice sacrificed on day 63 were probed with the anti-NK1.1 monoclonal antibody labelled with FITC. The percentage values shown above represent the percentage of NK1.1+ splenocytes from the 1 × 10⁵ probed cells analysed with a flow cytometer. The error bars indicate the standard deviation (SD) of triplicate measurements. The letters (a, b, c, d, e, f) shown above the bars represent the statistical significance of the measurements. Percentage values which are marked by different letters are significantly different (p < 0.001), and those marked by the same letters are not significantly different.

