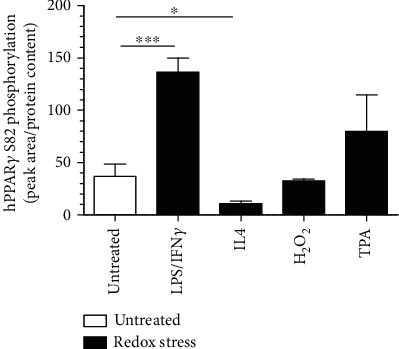
Figure 5.

hPPARγ phosphorylation states and its connection to redox-modification. A quantification (mean values ± SD) of hPPARγ serine S82 phosphorylation of reanalysed LC/MS data sets of HA-immunoprecipitated HA-tagged hPPARγ expressed in J774A.1 cells following different treatments (1 μg/ml LPS combined with 10 U/ml IFNγ for 4 h, 10 ng/ml IL4 for 4 h, 100 μM H2O2 for 15 min, 1 μM TPA for 30 min) as indicated is provided. Mean values of three individual experiments ± SD are provided. (∗p ≤ 0.05, ∗∗∗p ≤ 0.001).
