Figure 9.

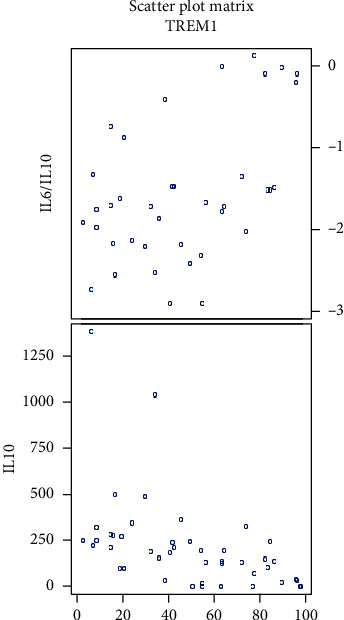
Scatter plots showing correlations of CD14+ TREM-1+ cell percentage with IL-6/IL-10 ratio and with IL-10 in all gliomas (data log transformed).

Scatter plots showing correlations of CD14+ TREM-1+ cell percentage with IL-6/IL-10 ratio and with IL-10 in all gliomas (data log transformed).