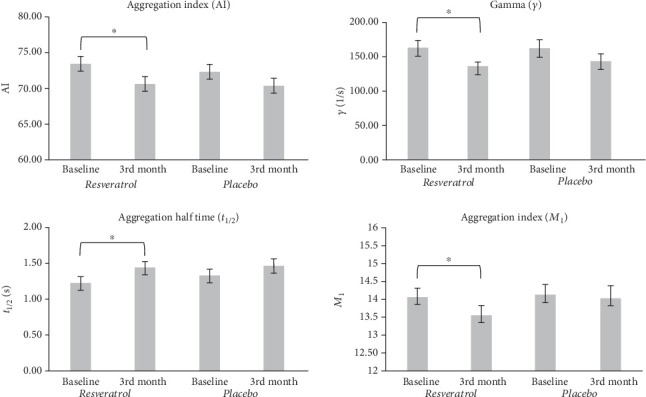
Figure 2.

Effect of resveratrol on red blood cell aggregation. Values are expressed as mean ± SEM. Star (∗) = significant difference in 3rd month values of the resveratrol group compared to the baseline values of the resveratrol group (p < 0.05). Baseline: measured values at randomization in the resveratrol or placebo group; 3rd month: patients treated with resveratrol or placebo for 3 months; M1 value: aggregation index at 3 s−1 rotation speed of the Myrenne aggregometer; AI: aggregation index measured by LORCA aggregometer; t1/2 (s): aggregation half time; γ (1/s): threshold shear rate.
