
Figure 3.
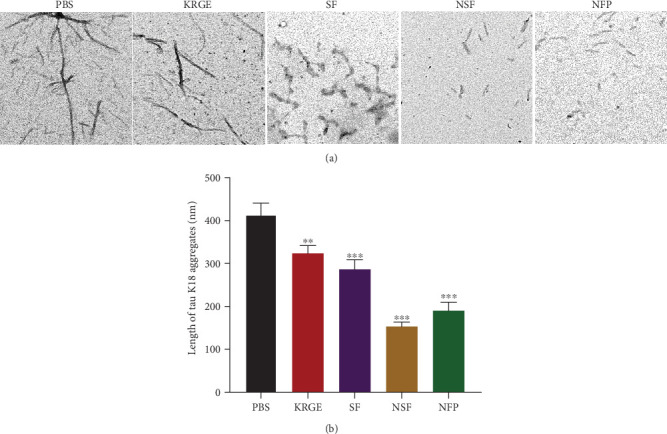
The effect of KRGE and KRGE fractions on the aggregation of tau K18 using the transmission electron microscopy (TEM). (a) Images of tau K18 aggregates in the absence or presence of 500 μg/mL KRGE or KRGE fractions (scale bar = 200 nm). (b) The length of the tau K18 aggregates was quantified in TEM images. Values represent the mean ± standard error of the mean. Statistical significance was determined by one-way analysis of variance followed by Tukey's multiple comparison test. ∗∗p < 0.01; ∗∗∗p < 0.001.