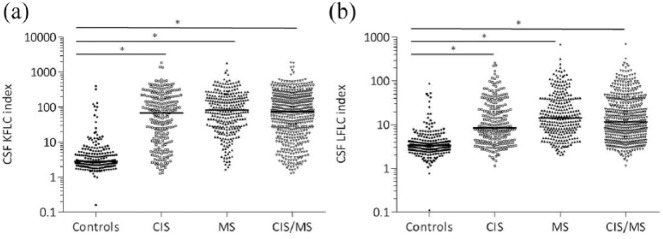
Figure 1.
CSF KFLC and LFLC indices of CIS, MS, CIS/MS and controls. (a) Levels of KFLC indices, (b) levels of LFLC indices. Horizontal bars in the scatter dot plot represent the median.
CSF: cerebrospinal fluid; KFLC: kappa free light chains; LFLC: lambda free light chains; CIS: clinically isolated syndrome; MS: multiple sclerosis.
*p ⩽ 0.001.

