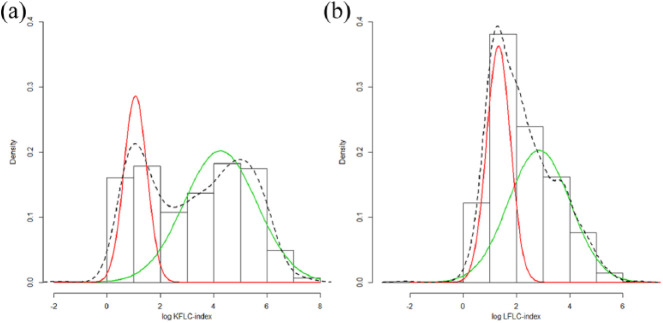
Figure 2.
Cerebrospinal fluid (a) KFLC and (b) LFLC cut-off values based on mixture modeling. The red (low values) and green (high values) lines are the individual components of the estimated mixture distributions, the dotted line is the combined estimated mixture distribution. The cut-off is defined as the point where the red and green lines cross.

