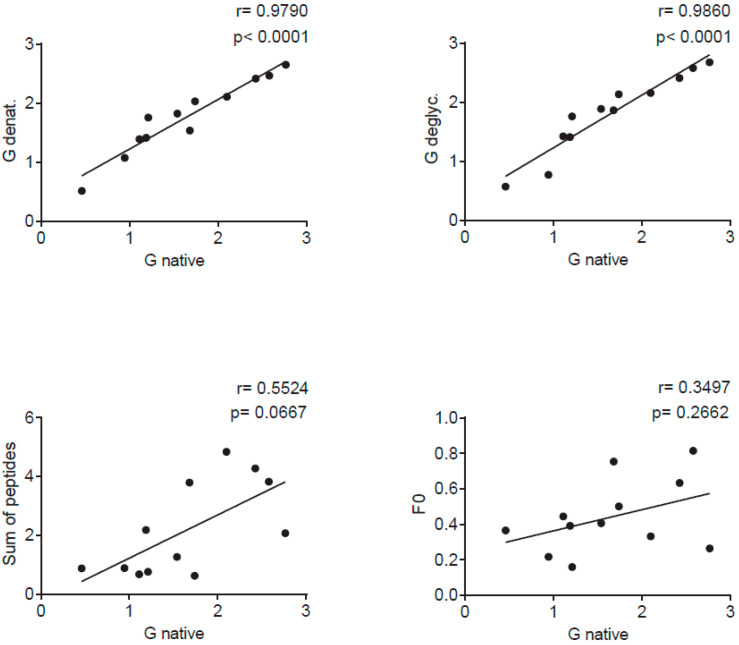
Figure 5.
Correlations of IgG levels specific for native G (x-axes) and denatured G (SDS, TCEP and heat) (y-axis) (upper left), deglycosylated G (y-axis) (upper right), the sum of peptide-specific IgG (y-axis) (lower left) and for F0 (y-axis) (lower right) measured in sera from 12 adult individuals in individual scatter plots with Spearman correlation coefficient r and p values.

