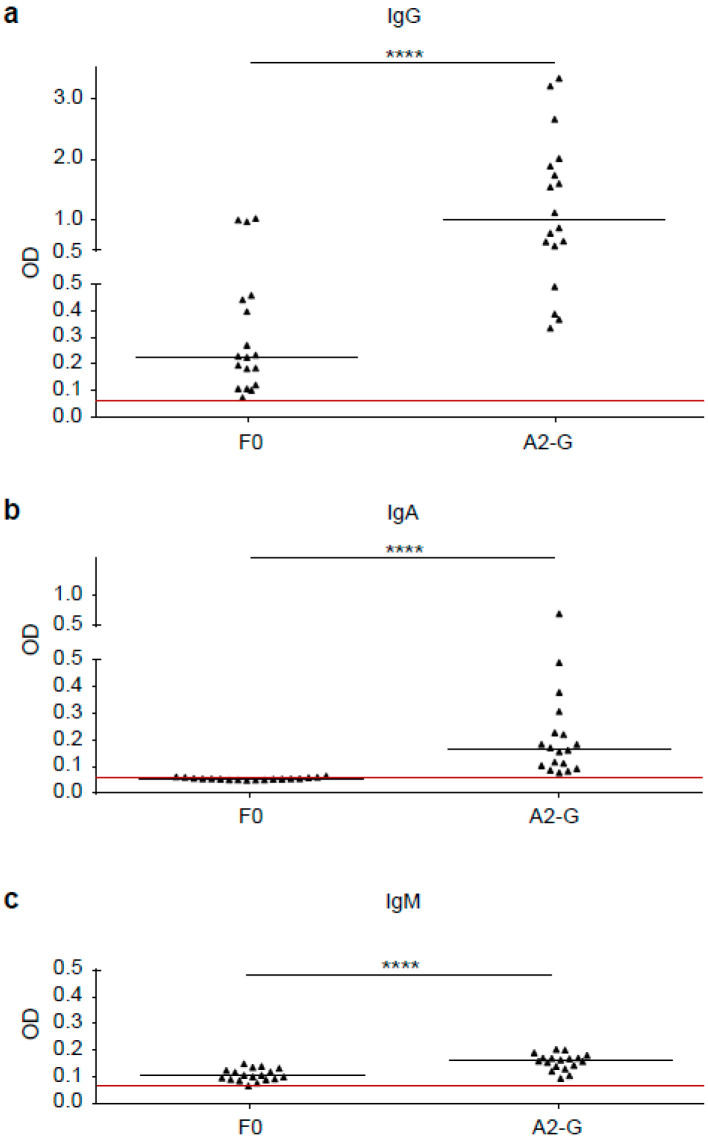
Figure 6.
Comparison of G and F0-specific human IgG, IgM and IgA responses. Shown are IgG (a), IgA (b) and IgM (c) levels (y-axes: optical density OD values) against A2-G and F0 measured by ELISA in sera from 18 healthy adult individuals. Horizontal lines within scatter plots indicate median values. The cut-off (mean of buffer control plus three times standard deviation) is indicated by horizontal red lines. Significant differences between G and F0-specific antibody levels are indicated (**** p < 0.0001).

