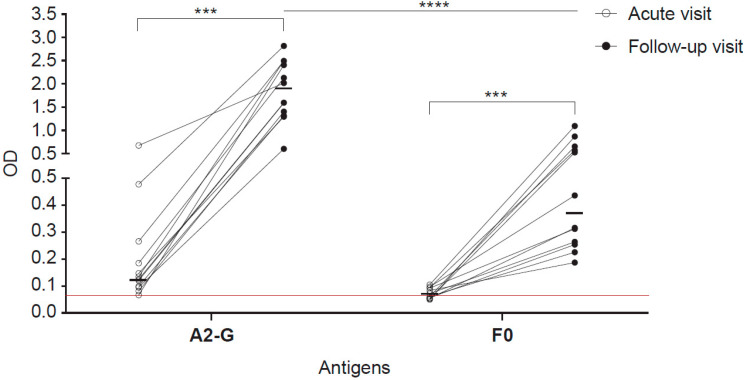
Figure 8.
IgG responses specific for G and F0 in children with an acute wheezing attack at base-line and in follow-up blood samples. Shown are optical densities (ODs) corresponding to IgG levels specific for A2-G and F0 determined in sera from children attending emergency care at base line (open circles) and in follow-up samples collected several weeks after (black circles). The cut-off (mean of buffer control plus three times standard deviation) is indicated by horizontal red lines. Horizontal lines within the scatter plots indicate median values. Depicted are 12 RSV-positive children according to PCR test. Comparative tests were non-parametric paired (Wilcoxon matched-pairs signed rank test) or unpaired test (Mann-Whitney U test) as appropriate. Significant differences of antibody levels between base-line (acute visit) and follow-up samples are indicated (*** p < 0.001, **** p < 0.0001).

