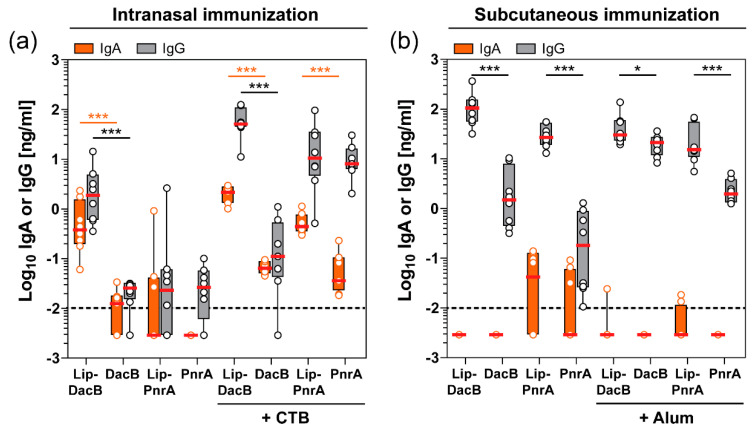
Figure 4.
Impact of antigen lipidation on the local antibody response in the nasal tissue of mice. Intranasally (a) or subcutaneously (b) immunized C57BL/6 mice (n = 8/group) were intranasally infected with S. pneumoniae for three days followed by monitoring of nasal tissue homogenates for their antigen-specific IgA and IgG concentrations (Log10 ng/mL) using ELISA. Box plots represent group median (horizontal red line), first and third quartiles (box), and the range of data (whiskers). Symbols represent individual mice. The dashed line indicates the lower limit of detection. Statistical significance was determined using a Mann–Whitney U test. *, p < 0.05; ***, p < 0.001.

