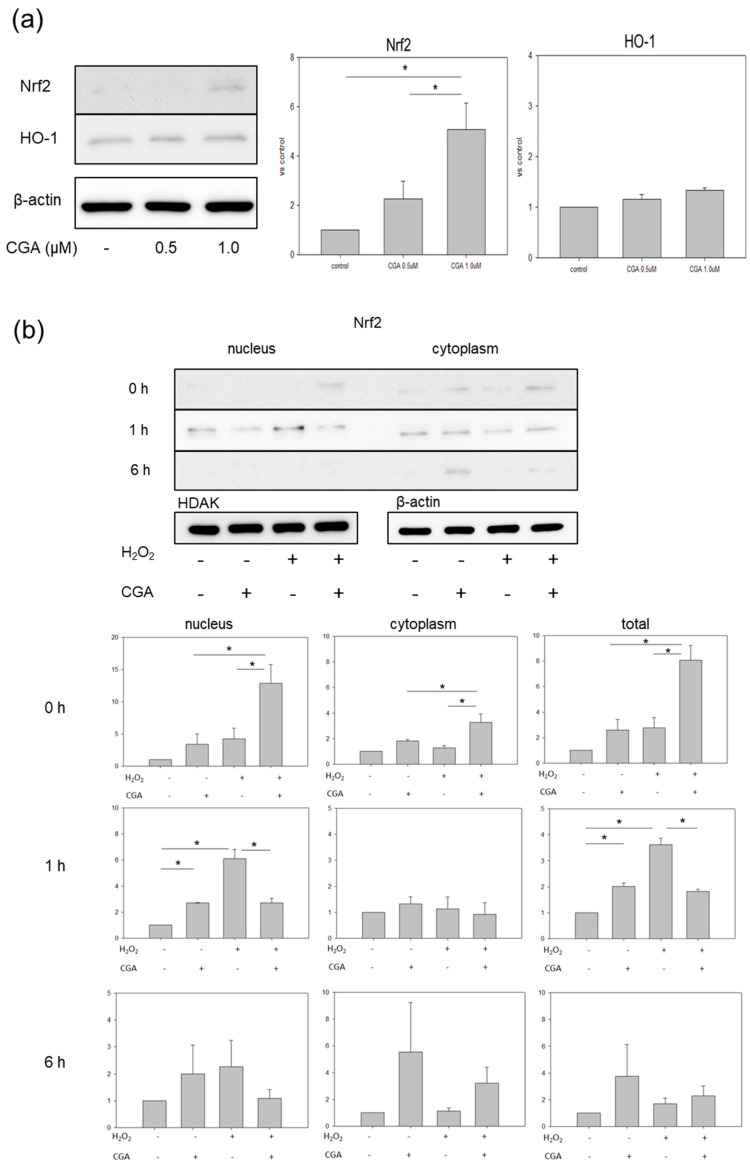
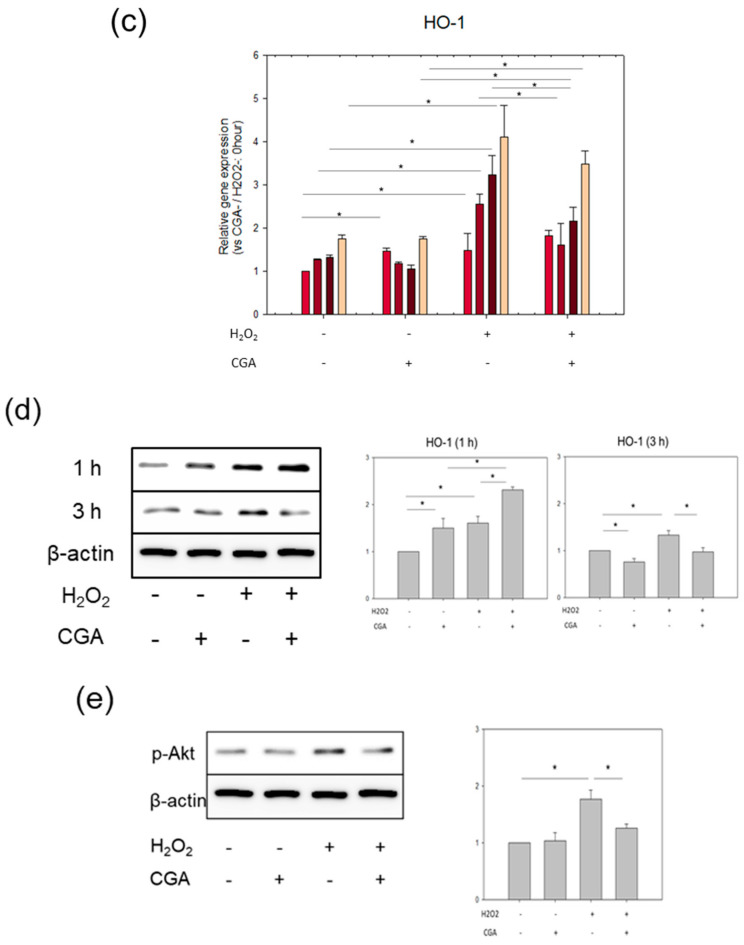
Figure 4.
Effects of CGA on the expression of Nrf2-related proteins and mRNA. (a) Protein expression of Nrf2 and HO-1 in CGA-treated HUVECs (n = 3), * p < 0.05. Values represent the means ± SE of three experiments.; (b) Protein expression of Nrf2 in the nucleus and cytoplasm in CGA-treated HUVECs after stimulation with H2O2 (n = 3), * p < 0.05. Values represent the means ± SE of three experiments; (c) mRNA (n = 3), * p < 0.05. Each bar presents the mean ± SE of three experiments and (d) protein expression of HO-1 (n = 3). Values represent the mean ± SE of three experiments.; (e) Protein expression of p-Akt (n = 3). Values represent the means + SE of three experiments.


